

Last Friday, I told you the weak jobs report was the first real evidence that the Fed headwind crushing gold all year was finally starting to lift. I need to open this week by being straight with you: that turn got interrupted almost immediately, and I want to walk you through exactly what happened and what it means, because the honest picture is more useful than a clean story.
Here’s what interrupted it. On July 8, at the NATO summit in Ankara, President Trump declared the Iran ceasefire “over.” Airstrikes resumed — US forces hit targets in Iran over two days, Iran retaliated against US bases across the region — and oil surged more than 7% on the week. And that reignited the exact machine that has driven gold down all year: oil spikes, inflation expectations rise, the Fed stays hawkish, real yields climb, and gold falls. Gold dropped back to around $4,075 midweek. Silver, as always, got hit harder, sliding toward $58.
But then something worth noticing happened. By Friday, gold had steadied back above $4,100 as the dollar softened and reports came in that the US and Iran would continue peace talks despite the flare-up. And when you step back from the day-to-day whipsaw, gold actually finished the week slightly higher — its first weekly gain in five weeks. It got hit with a renewed war, an oil spike, and fresh inflation fears, and it still closed the week up. That tells you something about where the selling pressure now stands.
Here’s the frame that makes sense of all of it, and it’s the most useful thing I can give you this week. The World Gold Council just published its mid-year outlook, and its valuation model puts gold’s fair value at almost exactly $4,100 an ounce right now. Gold is trading at $4,115. In other words, after the most dramatic year gold has had in decades — a record high above $5,500 in January, a brutal 26% correction, a war, a hawkish new Fed chair — the price has landed almost precisely where the most respected model in the industry says it should be, given the world as it actually is today. That’s not a market in chaos. That’s a market that has found its level and is now waiting for the next real piece of news to tell it where to go.
This is an in-depth issue, because there’s a lot to make sense of: the war’s return, the Fed’s genuine internal split, silver’s outsized pain, China’s relentless buying, and the single data point next week that will decide gold’s direction. Let me walk you through all of it.
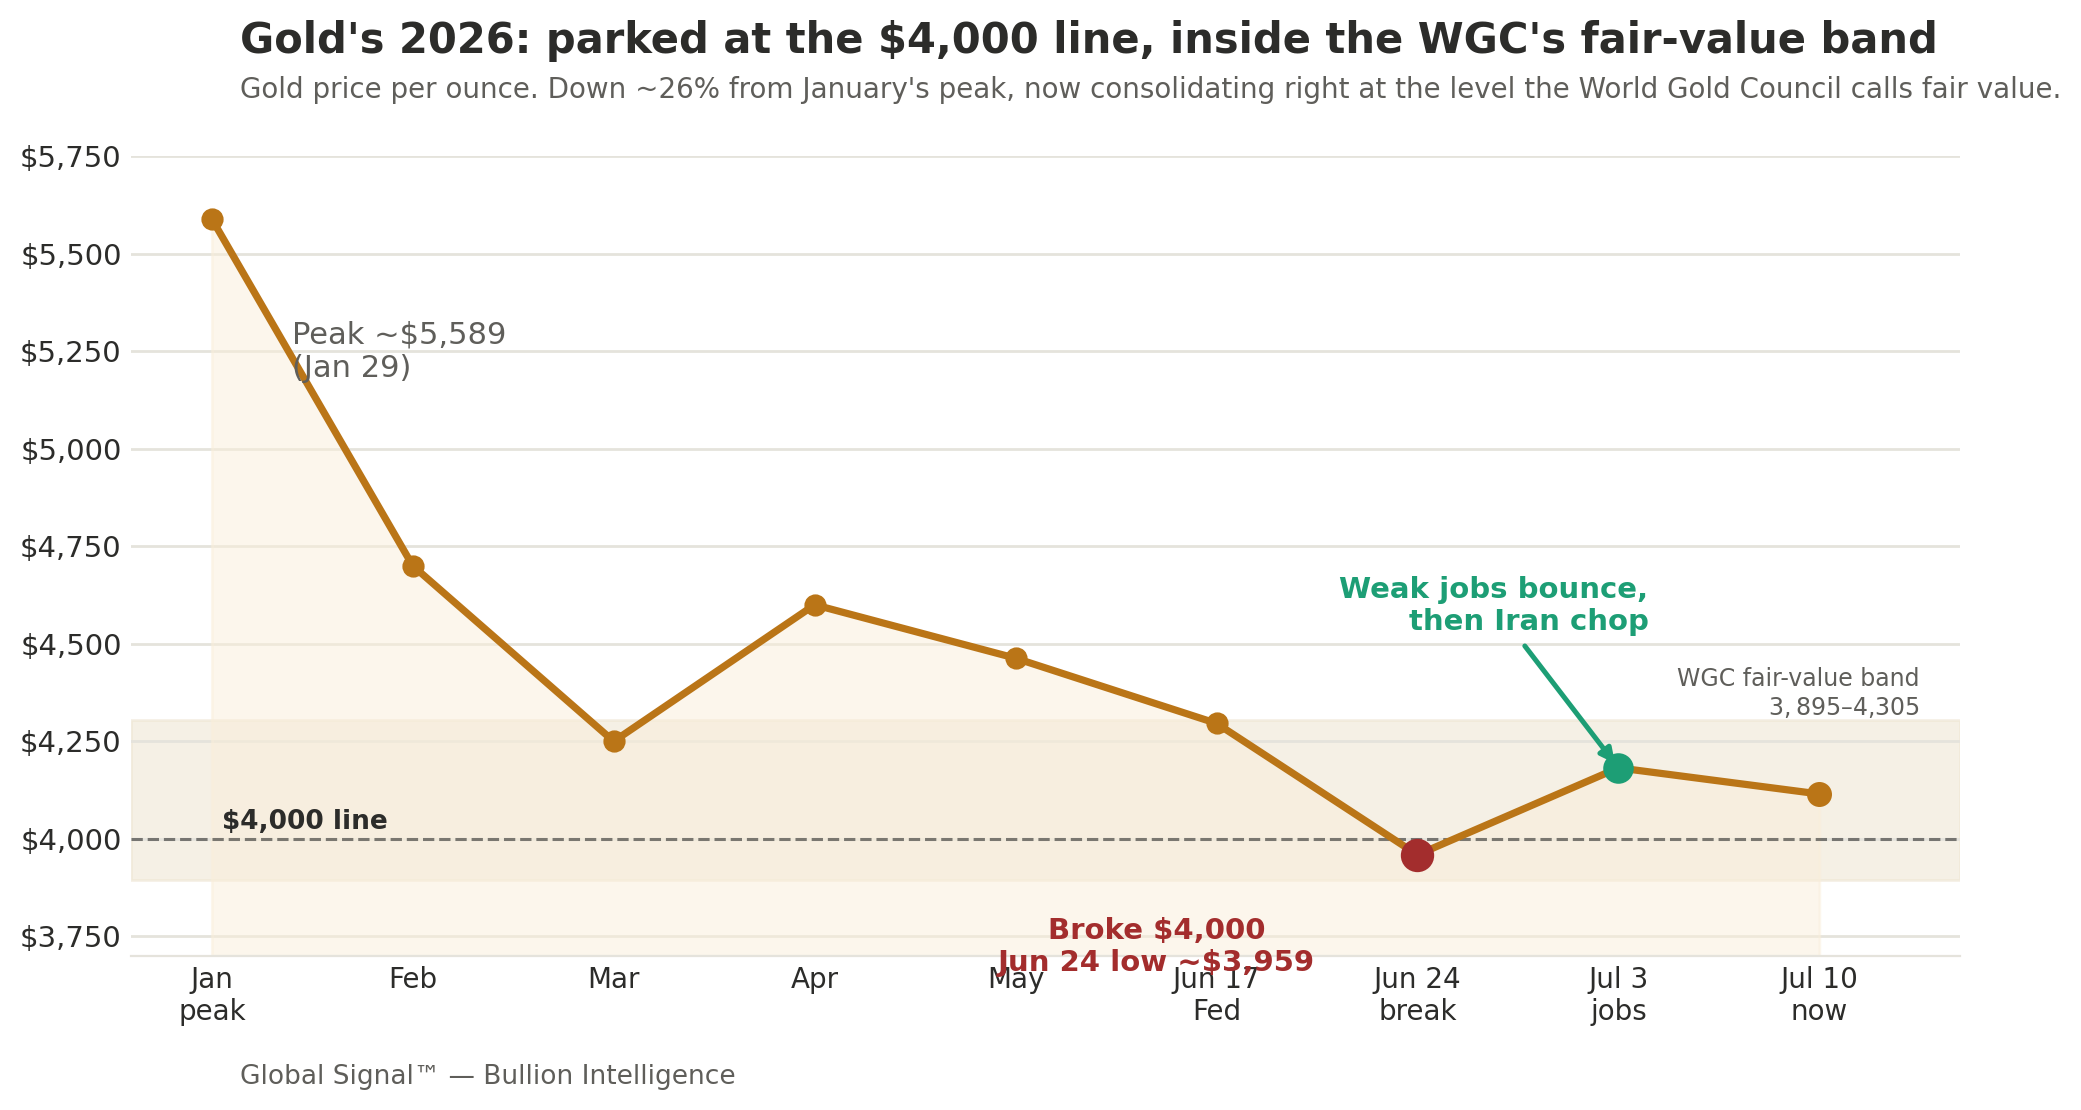
The Picture in One Chart
The chart above shows gold’s whole 2026 in one view, and this week’s story sits right at the end. The record peak near $5,589 in January. The long grind down through the spring. The break below $4,000 in late June — that red dot at the bottom. And then the recovery back up into the shaded band. That band is the key: it’s the World Gold Council’s fair-value range, $3,895 to $4,305, and gold is now sitting right inside it, just above the critical $4,000 line. After all the drama, the price has come to rest almost exactly at fair value. The whole question now is which way it breaks out of that band — and the next section explains what decides it.
Opening Signal
Here’s the heart of this week: gold is caught in a tug-of-war between two forces, and for now they’ve fought to a draw right at fair value.
On one side is the war and the Fed. The Iran ceasefire collapsing sent oil up 7%, which revives inflation fears, which keeps the Fed hawkish and real yields high — all of that pushes gold down. This is the machine that has dominated 2026, and it came roaring back this week when Trump declared the deal dead.
On the other side is the floor. Central banks keep buying — China alone added nearly 15 tonnes in June, its twentieth straight month. The dollar softened into Friday. Peace talks resumed even after the flare-up. And gold is now cheap enough, after a 26% correction, that dip-buyers are stepping in. All of that holds gold up.
For the moment, those two forces have battled to a standstill, and the standstill happens to sit right at the $4,100 fair value the World Gold Council’s model identifies. That’s why gold chopped around all week but finished roughly flat. The draw won’t last — one side will win — and the tiebreaker arrives next week in the form of a single inflation number. Let me explain the whole board.
Executive Signal — Premium
Gold is parked at fair value, and that’s a more stable place than the recent volatility suggests. The World Gold Council’s new mid-year valuation framework puts gold’s fair value at approximately $4,100 an ounce, with a tolerance band of $3,895 to $4,305, based on the market’s current expectation of one more Fed hike by October and inflation peaking near 3.9%. Gold at $4,115 sits right at that midpoint. The wild swings of the past two weeks have actually resolved into equilibrium — the price now reflects the world as it is, and it will move meaningfully only when the world changes.
The war’s return this week was the dominant force, and it cut against gold in the short term. Trump declaring the Iran ceasefire “over” on July 8 sent oil up more than 7% and reignited the inflation-and-hawkish-Fed machine that has driven metals down all year. This is the counterintuitive dynamic we’ve explained before: a geopolitical shock that raises oil can push gold down, not up, because the inflation it creates keeps the Fed aggressive and real yields high. That’s exactly what happened midweek. The partial recovery into Friday, on a softer dollar and resumed peace talks, shows the war premium and the rate pressure roughly canceling out.
The Fed is genuinely split, which is the real story beneath the price. The minutes from Warsh’s first meeting, released July 8, revealed a committee divided almost exactly in half: nine of eighteen participants expect at least one rate hike before year-end, eight expect no change. That’s not a hawkish Fed steamrolling toward hikes — it’s a divided Fed that could tip either way on incoming data. For gold, this matters enormously, because it means the single biggest force acting on the price is balanced on a knife’s edge, waiting for the data to push it one way or the other.
The structural floor held again, and China is the clearest proof. The People’s Bank of China added 14.93 tonnes of gold in June, its largest single-month purchase since 2023 and its twentieth consecutive month of buying — and it did this during gold’s worst quarterly decline in thirteen years. Chinese Q1 imports tripled to 317 tonnes. This is the behavior that defines the whole cycle: the world’s most strategic reserve managers using the weakness to accumulate, buying precisely when the price is falling, because their horizon is measured in decades and their goal is diversifying away from the dollar. The floor isn’t a theory. It’s 15 tonnes a month from Beijing alone.
Silver took the harder hit again, and the reason is the same as always. Silver fell toward $58 midweek, worse than gold in percentage terms, because roughly 58% of silver demand is industrial — solar, semiconductors, EV components — so it gets punished by both the monetary headwind and the fear that a war-slowed global economy means less factory demand. But that same dual nature, plus a sixth straight year of supply deficit, is why silver has the most explosive upside when the turn finally comes. The deeper it falls now, the more coiled the spring.
The near-term direction comes down to one number: June CPI, out July 14. With the Fed split and gold at fair value, the inflation report is the tiebreaker. A soft reading — showing the collapse in oil earlier this summer finally cooling inflation — would compress rate-hike odds and point gold back toward the top of its band. A hot reading would extend the real-yield pressure and put the $4,000 floor back in play. Everything routes through that Tuesday.
Key Signals at a Glance — Premium
Gold trades near $4,115, right at the World Gold Council’s fair-value estimate of ~$4,100 (band: $3,895–$4,305). Despite a volatile week, it finished slightly higher — its first weekly gain in five weeks.
The Iran ceasefire collapsed: Trump declared it “over” July 8 at the NATO summit, airstrikes resumed both ways, and oil surged 7%+ on the week — reigniting the inflation→hawkish-Fed→gold-down machine.
The June FOMC minutes (released July 8) revealed a Fed split almost evenly: 9 of 18 participants expect at least one 2026 hike, 8 expect none. Markets price a ~50% chance of a September hike.
China’s central bank (PBoC) added 14.93 tonnes in June — its largest monthly purchase since 2023 and its 20th straight month — during gold’s worst quarter in 13 years. Q1 Chinese imports tripled to 317 tonnes.
Silver fell harder, toward $58 midweek (down ~52% from its January peak), because ~58% of its demand is industrial. But it’s in a 6th straight year of supply deficit — the coiled-spring setup.
The decisive near-term catalyst is June CPI on July 14, alongside Warsh’s congressional testimony the same morning. Bank targets remain far above spot: JPMorgan $6,000, though BofA and HSBC trimmed their 2026 averages this week ($4,360 and $4,560) on the hawkish Fed.
The real positioning map starts below →
Conviction map, named vehicles for each thesis, forward scenarios with confidence tiers, the Cycle & Cosmos read, and the Watch Triggers for the weeks ahead — in the Premium Subscription. Premium subscribers see this on publish day. Free subscribers receive it 7 days later.
Market Breakdown — Premium
This Week’s Pulse
Gold sits near $4,115 after a volatile week that saw it fall to $4,072 midweek on the Iran flare-up before recovering above $4,100 on a softer dollar and resumed peace talks. Remarkably, it still finished the week up about 2.3% — its first weekly gain in five weeks. Silver is near $60 after dipping toward $58, still down roughly 52% from its January peak, with the gold-to-silver ratio stretched near 68. The dollar pulled back from its 13-month high, which was the main support for Friday’s bounce. Oil surged more than 7% on the week on the renewed conflict, putting inflation back at the center of the Fed conversation. Markets now price roughly a 50% chance of a September rate hike, down from 63-65% before the weak jobs report but still elevated. The whole complex is coiled, waiting for the July 14 CPI print.
The War That Pushes Gold Down
It’s worth explaining again, because it’s the most counterintuitive thing in this market and it dominated the week. When you hear “war escalates,” instinct says gold should soar as a safe haven. But in 2026, the opposite keeps happening, and the mechanism is precise. The Iran conflict disrupts oil flows through the Strait of Hormuz. Oil spikes. Higher oil means higher inflation. Higher inflation means the Fed stays hawkish or hikes. A hawkish Fed means higher real interest rates and a stronger dollar. And higher real rates plus a stronger dollar are direct negatives for gold, which pays no interest. So the war’s inflationary effect, working through the Fed, has been overpowering its safe-haven appeal all year. This week was a textbook example: Trump kills the ceasefire, oil jumps 7%, and gold falls. Understanding this is what keeps you from being confused every time the headlines and the price seem to disagree.
Fair Value and the $4,000 Line
The single most useful anchor this week is the World Gold Council’s valuation framework, because it turns the chaos into something legible. Their model links gold’s price to real yields, inflation expectations, the dollar, and central bank demand, and it currently spits out a fair value of about $4,100, with a band from $3,895 to $4,305. Gold is sitting right at the midpoint. That’s genuinely clarifying: it means gold isn’t overpriced or underpriced right now — it’s fairly valued for a world with one more Fed hike coming and inflation near 3.9%. The WGC also flagged the key risk directly: sustained trading below $4,000 could trigger additional selling, because that level has been support since November and breaking it decisively would invite momentum sellers. That’s why the $4,000 line is the one to watch, and why the July 14 CPI matters so much.
Macro Undercurrents — Premium
Five forces are working beneath the price this week.
The war’s return reset the near-term trend, and its path is the swing factor. The collapse of the ceasefire was the week’s dominant event, and it reintroduced the oil-inflation-Fed pressure that the weak jobs report had briefly relieved. The crucial question now is whether this is a final flare-up before a real peace deal or the start of a sustained re-escalation. Reports of resumed talks into Friday suggest the former is still possible, but Trump’s “over” declaration and threat of a new blockade suggest real risk of the latter. Oil is the live gauge: if it stays elevated, gold faces continued rate pressure; if peace talks bring it back down, the inflation fear fades and gold’s path clears.
The Fed’s genuine split is the most important structural fact. Nine hawks, eight who’d hold — that’s a committee that could tip either way, which means gold’s biggest driver is balanced precisely on the incoming data. This is actually a more constructive setup for gold than a uniformly hawkish Fed would be, because it means a single soft inflation print or a further crack in the labor market could flip the balance toward no-hike or even cuts, which would be a powerful gold tailwind. The knife’s edge cuts both ways, but it means the hawkish pressure is not entrenched — it’s contingent, and contingent pressure can lift quickly.
The oil-to-inflation transmission is the mechanism to watch into CPI. Here’s the subtle timing issue. Oil collapsed earlier this summer as the first ceasefire held, falling below $69. That decline should show up as cooling inflation in the July 14 CPI report for June. But oil just spiked 7% this week on the ceasefire collapse — and that will show up in next month’s data, not this one. So there’s a real chance the July 14 print shows encouraging disinflation from the earlier oil drop, even as the market worries about the new spike. That timing quirk could produce a soft CPI that gives gold a lift, before the new oil spike complicates the following month. Watch for it.
China’s buying is the floor, and its consistency through the worst quarter in 13 years is the tell. The PBoC adding 15 tonnes in June, during gold’s steepest decline in over a decade, is the single clearest demonstration of what sets the floor under this market. This isn’t price-sensitive trading — it’s strategic accumulation on a multi-decade horizon, driven by the lesson of 2022, when the freezing of Russian reserves showed every non-aligned nation that dollar assets can be sanctioned. China is systematically building gold reserves to back a credible renminbi alternative, and it buys regardless of price. Twenty straight months. That’s the structural bid that makes deep corrections opportunities rather than warnings.
The analyst community is genuinely divided, and honesty requires showing both sides. The bulls remain loud: JPMorgan holds a $6,000 target, and the structural case (central banks, de-dollarization, the silver deficit) is intact. But this week brought real cuts: Bank of America trimmed its 2026 average forecast 14% to $4,360 citing the hawkish Fed, and HSBC cut to $4,560. Macquarie and OCBC have argued for range-bound-to-lower prices as real yields stay elevated. The honest synthesis is the WGC’s: rangebound around $4,100 under current conditions, with a genuine breakout possible in either direction depending on the Fed, the war, and the data. This is not a slam-dunk bull setup right now. It’s a balanced one with a structural floor and real near-term headwinds.
Smart Money — Premium
Three institutional patterns define the week.
Central banks bought the worst quarter in thirteen years, which is the definition of smart-money conviction. China’s 15 tonnes in June is the headline, but the pattern is broad: the WGC estimates Q1 buying actually rose to 244 tonnes once unreported purchases (visible through Swiss refinery flows and London OTC data) are counted, and its survey shows an increasing share of reserve managers expecting to add over the next year. The official sector is expected to buy above its long-run average of ~600 tonnes again in 2026. When the most patient, most strategic buyers on earth accumulate through the steepest decline in over a decade, they’re telling you they see the correction as noise against a structural trend. Follow the buyers who think in decades, not the traders who think in days.
The forecasters split, and the split itself is information. The divergence between JPMorgan’s $6,000 and Bank of America’s freshly-cut $4,360 isn’t confusion — it’s a genuine disagreement about one variable: how hawkish the Fed stays. The bulls are betting the labor market cracks and the Fed pivots toward cuts, unleashing the structural demand. The cautious camp is betting real yields stay elevated and keep a lid on prices through year-end. Both are coherent. What they agree on is more telling than where they differ: essentially nobody credible is calling for a collapse in the structural thesis. The debate is between “rangebound near $4,100” and “rally toward $6,000” — not between up and down. That asymmetry favors patient accumulation.
The speculative unwind has largely happened, leaving cleaner hands. The WGC noted that momentum and positioning drove about 24-25% of gold’s price variability this year, concentrated in January’s rapid run-up, and that much of that speculative excess has now unwound, with more fundamental demand emerging at current levels. In plain terms: the hot money that chased gold to $5,500 has been flushed out, and the buyers left at $4,100 are the real ones — central banks, long-term investors, physical accumulators. A market held up by fundamental demand rather than speculation is a healthier, more durable market, even if it’s less exciting.
Conviction Map — Premium
Overweight — physical gold and silver in allocated form, silver-weighted given its deeper discount and the supply deficit, gold and silver royalty and streaming names, and quality producers. Gold at fair value with a structural floor is a reasonable accumulation zone, though not the screaming bargain it was at the $3,959 low.
Tactical — accumulate in tranches into the July 14 CPI, which is a genuine binary. A soft print points toward the top of the band; a hot print puts $4,000 back in play and offers a better entry. Given the coin-flip, scaling in rather than committing all at once is the disciplined approach. Keep dry powder for a possible retest of $4,000.
Underweight — leveraged paper positions that get whipsawed by the war headlines (this week showed why), unallocated accounts, and weak miners that can’t endure a rangebound-to-lower price environment if the cautious forecasters are right.
Hedges — physical metal remains the core hedge against the fiscal and de-dollarization story that China’s relentless buying keeps confirming. Hold the structural allocation through the chop, and treat the war-driven volatility as noise around a fair-value anchor.
Portfolio Playbook — Premium
The cleanest expressions of the thesis, grouped by role. The emphasis leans silver-heavy given the deeper discount and the supply deficit.
Physical and core exposure:
IAU (iShares Gold Trust) — low-fee core gold exposure, simple to hold in any brokerage account
SIVR (abrdn Physical Silver Shares) — physically-backed silver at a competitive fee, exposure to the deeper discount
PSLV (Sprott Physical Silver Trust) — fully allocated, redeemable physical silver for those who want delivery optionality
Royalty and streaming — the lower-risk way to own miners:
FNV (Franco-Nevada) — the largest, most diversified gold royalty, built to weather rangebound stretches
WPM (Wheaton Precious Metals) — silver-weighted royalty leverage, the cleanest play on a silver recovery and the supply deficit
RGLD (Royal Gold) — a focused, financially disciplined royalty name
Producers and broad exposure:
AEM (Agnico Eagle) — a premier, low-cost gold producer with a strong balance sheet
PAAS (Pan American Silver) — a quality silver producer with real leverage to a silver repricing
GDX (VanEck Gold Miners ETF) — a diversified basket of major miners for one-ticket exposure
How to use the week: gold at fair value with a structural floor argues for steady accumulation rather than either chasing or fleeing. Buy in tranches into the July 14 CPI binary, keep powder for a possible $4,000 retest, and lean silver-heavy given the deeper discount and the deficit. The central banks are buying at these levels; patient holders can accumulate alongside them, but size for a rangebound outcome as well as a rally.
Cycle & Cosmos — Premium
A Common-Sense Guide for Investors
There’s something almost philosophical about where gold sits this week, and it’s worth pausing on, because it reveals a truth that goes deeper than any single price.
After the most chaotic year gold has had in a generation — a record high, a war, a 26% crash, a new Fed chair, oil spiking and collapsing and spiking again — the price has come to rest almost exactly at the number a careful model says it should be. All that noise, all that fear and greed, all those headlines, and the market found its way to fair value anyway. That’s not a coincidence. That’s a deep principle at work, and understanding it will make you a calmer, better investor.
The market is a scale, and it always finds level. Think of gold’s price like water finding its level, or a scale settling after you drop weight on it. In the short term, it swings wildly — fear shoves it down, greed pulls it up, a war headline knocks it sideways. But underneath all that motion is a true weight, a fair value set by the real forces of interest rates, inflation, the dollar, and demand. And no matter how violently the price swings, it keeps getting pulled back toward that true weight. This week, after all the drama, gold settled right at its true weight of $4,100. The lesson: don’t panic at the swings. Watch the level they keep returning to.
The patient money knows the weight; the nervous money watches the swings. Here’s the difference between the two kinds of participants in this market. The nervous money — the traders, the leveraged, the headline-chasers — watches every swing and reacts to it, getting shaken out at the bottom and sucked in at the top. The patient money — the central banks, the long-term holders — ignores the swings entirely and buys based on the weight. China added fifteen tonnes in June, during the worst quarter in thirteen years, because China isn’t watching the swing. China is watching the weight, and the weight, over the long run, keeps rising as the world’s debt grows and trust in paper money erodes. When you feel the urge to react to a scary week, ask yourself which kind of money you want to be.
The war teaches the same lesson in a different language. This week the war came back, and gold fell — the opposite of what instinct expects. But there’s a deeper pattern here too. The chaos of the world doesn’t move gold’s true weight in a straight line; it moves it through the complicated machinery of oil and inflation and central banks. The person who reacts to the headline (”war! buy gold!”) gets it backwards. The person who understands the machinery stays calm and watches the weight. In every domain — markets, and honestly, life — the reactive lose to the patient, and the patient are the ones who understood the underlying mechanism instead of the surface noise.
Where the long cycle still points. We remain in that 2025-2027 window where the old debt-based order gets tested and real, tangible value reasserts its ancient role. Gold settling at fair value after a violent correction isn’t a contradiction of that thesis — it’s the thesis working. The speculation got flushed, the weak hands sold, and the price found the level where the real buyers — the central banks, the patient accumulators — are willing to keep buying. That level will rise over the years as the structural forces grind on. The swings will terrify people out of their positions along the way. Don’t be one of them.
The takeaway. Gold is sitting exactly where the model says it should, which is the calmest possible place for a metal that just lived through chaos. The war will keep swinging the price; the Fed will keep swinging the price; next week’s inflation number will swing it again. But underneath all of it, the true weight is set by forces that favor real assets over the long run, and the patient money — the central banks buying through the worst quarter in thirteen years — knows it. If gold is your anchor through the turbulence ahead, a moment when it’s fairly valued and the strategic buyers are accumulating is a moment to add steadily, ignore the swings, and watch the level. Be the patient money. That’s the whole game.
What to watch right now:
June CPI on July 14 — the tiebreaker that decides whether gold breaks toward the top of its band or retests $4,000.
The $4,000 line — the level the World Gold Council warns could trigger more selling if it breaks decisively.
The Iran peace talks — whether the flare-up resolves (oil falls, gold’s path clears) or re-escalates (oil stays up, rate pressure continues).
Forward Scenarios — Premium
Rangebound-at-fair-value case — High confidence — The base case, and the WGC’s own. Gold stays within its $3,895–$4,305 band through the summer as the Fed stays split, the war simmers without fully resolving or exploding, and the data sends mixed signals. Central banks keep buying, the floor holds, and gold consolidates near $4,100 while it waits for a decisive catalyst. Unexciting, constructive, and the most probable near-term path. Confirms if: CPI lands near expectations, the war neither resolves nor explodes, and gold holds the band.
Rally-restart case — Medium confidence — A soft July 14 CPI (helped by the earlier oil collapse) compresses rate-hike odds, or the labor market cracks further, and the Fed’s split tips toward no-hike or cuts. The dollar rolls over, real yields fall, and gold breaks the top of its band toward $4,500, with silver leading powerfully on its deficit. This is the WGC’s identified upside catalyst and the bulls’ base case. Confirms if: CPI comes in soft, the dollar keeps falling, and rate-cut expectations for 2027 pull forward.
Break-$4,000 case — Medium confidence — A hot CPI (or the new oil spike feeding through faster than expected) keeps the Fed hawkish, real yields climb, and the dollar strengthens. Gold breaks decisively below $4,000, triggers the momentum selling the WGC warned about, and tests toward $3,800 before the central bank floor catches it. A deeper accumulation zone, not a thesis break. Confirms if: CPI runs hot, the war keeps oil elevated, and gold loses $4,000 on volume.
Watch Triggers — Premium
June CPI on July 14, alongside Warsh’s congressional testimony the same morning. The decisive near-term catalyst. A soft print points gold toward the top of its band; a hot print puts $4,000 in play. Warsh’s testimony could amplify either move.
The $4,000 line. The World Gold Council explicitly warns that sustained trading below it could trigger additional momentum selling. It’s the single most important technical level, defended since November.
The Iran peace talks and oil. Whether the ceasefire collapse resolves into a real deal (oil falls, rate pressure eases, gold’s path clears) or re-escalates (oil stays elevated, the machine keeps pressuring gold). Oil is the live gauge.
The gold-to-silver ratio, near 68. Compression as silver leads confirms a genuine turn; silver outrunning gold on up days is the signature of a real metals recovery.
Central bank buying data. China’s 20-month streak and the broader official-sector accumulation are the structural floor. Continued buying through weakness confirms the thesis; any pause would be a caution flag.
TL;DR — Premium
I told you last week the weak jobs report was the first sign the Fed headwind was lifting — and this week interrupted that when the Iran ceasefire collapsed. Trump declared it “over” July 8, airstrikes resumed, oil surged 7%, and gold got knocked to ~$4,072 midweek before recovering above $4,100 on a softer dollar. Despite the chaos, gold finished the week up ~2.3% — its first weekly gain in five weeks.
The clarifying frame: the World Gold Council’s new model puts gold’s fair value at ~$4,100 (band $3,895–$4,305), and gold sits right there. After a record high, a 26% crash, and a war, the price found its true level. The Fed is genuinely split (9 of 18 expect a hike, 8 don’t), which means the data decides — and June CPI on July 14 is the tiebreaker. The structural floor held again: China bought 15 tonnes in June, its 20th straight month, during the worst quarter in 13 years.
Positioning: accumulate in tranches into the CPI binary, keep powder for a possible $4,000 retest, silver-weighted given the deeper discount and the supply deficit — physical (IAU, SIVR, PSLV), royalty (FNV, WPM, RGLD), producers (AEM, PAAS, GDX). The analyst split (JPMorgan $6,000 vs. BofA’s freshly-cut $4,360) is really a debate between “rangebound” and “rally,” not up vs. down. The Cycle & Cosmos read: the market is a scale that always finds its level, and gold just settled at its true weight — be the patient money, like the central banks buying through the worst quarter in 13 years.
Gold is sitting exactly where the model says it should. Now one inflation number decides which way it breaks.
— Written by The Global Signal Team
Global Signal™ is published for informational and educational purposes only. Nothing in this newsletter constitutes financial, investment, legal, or tax advice, nor a recommendation to buy, sell, or hold any security, asset, or strategy. The Cycle & Cosmos section is offered as interpretive and educational commentary only and makes no claim of causative effect on markets. All opinions are those of the author at the time of publication and are subject to change without notice. Markets involve risk, including possible loss of principal. Past performance is not indicative of future results. No client or advisory relationship is formed by reading this newsletter. Readers are solely responsible for their own decisions and should conduct independent research and consult a licensed professional before acting on any information. The author and publisher disclaim any liability for losses incurred based on this content. Full terms: https://globalsignalhq.substack.com/tos · © Global Signal™