


Opening Signal
For most of this year the case for gold rested on a single idea, that heavy government debt and strained fiscal credibility would push money toward the one asset no government can print. That idea carried gold to a record near $5,405 in January. Now the fiscal strain is still very much present, and gold is falling anyway. Understanding why is the point of this issue, because the reason is not that the thesis broke. It is that the same force can reach the gold price through two different doors, and lately it has been coming through the one that pushes gold down.
Gold is on track for its third straight weekly decline. It broke beneath its recent range on Thursday, tested $4,300, and has been trading near $4,330, down roughly two percent on the week and well below its January high. Silver has fallen much harder, which is a separate story worth telling on its own terms. The immediate cause across the complex is not a change in the debt picture but a move in interest rates and the dollar, driven by a hot producer-price reading, rising oil, and a bond market that keeps pushing long-term yields toward multi-decade highs.
The distinction that organizes this whole issue is between two ways fiscal strain reaches gold. When the strain shows up as fear of currency debasement, it supports the metal directly. When it shows up as rising bond yields, because investors demand more to hold government debt, those higher yields raise the real return on cash and bonds and pull money away from an asset that pays no interest. Both channels are real, and lately the yield channel has dominated. That is the near-term story, and it is why gold can fall in a stretch when every headline seems to argue for owning it.
A note on timing, because it shapes how to read what follows. This issue was finalized ahead of the August Consumer Price Index release, the last major inflation reading before the Federal Reserve meets on September 16. At our research cutoff the print was not yet available, so the framework below treats it as a scenario variable rather than a result, and lays out the specific market reactions that would matter once the number is known. That makes the CPI section a pre-committed analytical framework you can hold against what actually happened, which is more useful than retrospective storytelling. Beneath all of it, the structural buyer has not moved. China’s central bank added more gold in August than in any month since 2023, buying into the very weakness that shook out the faster money, and that divergence is the chart below.
Executive Signal
Gold is heading for a third straight weekly decline, and the driver is the rate-and-dollar channel rather than a change in the fiscal thesis. The metal broke beneath its recent range, tested $4,300, and has traded near $4,330, down roughly two percent on the week and well off its January record near $5,405. The proximate forces are a hot August producer-price report, a firmer dollar, elevated Treasury yields with the ten-year near 4.95 percent, and oil above $100 on the widening US-Iran conflict. The framework reads gold in this stretch as trading primarily as a real-rate expression, which is the mechanism through which higher yields pressure a non-yielding asset.
August inflation is the pivot this issue is built around, and the market was genuinely divided heading into it. This issue was finalized before the August CPI release. At the research cutoff, consensus looked for headline inflation around 0.4 percent on the month and roughly 3.4 percent over the year, lifted by energy, while core was expected near 0.2 to 0.3 percent monthly and easing toward about 2.4 percent annually. The prior day’s PPI set an instructive template, hot on the headline at 5.4 percent annual but softer on core at 0.2 percent monthly, below the 0.3 percent expected. Futures had moved to price a September hike as more likely than not, in the vicinity of 60 to 70 percent, and Fed Governor Waller had said plainly that a hot inflation print would put a hike in play. The framework’s guidance, established before the number, is to watch the real-yield reaction rather than the headline, because the energy-versus-core split can be read either way.
The Treasury’s long-duration buyback and this week’s thirty-year auction tell a more textured story than “nobody wants Treasuries.” Here it helps to keep three layers distinct. The evidence is that the Treasury expanded its long-dated buybacks, effective September 9, and states the purpose as liquidity support in the longer-dated nominal sectors. At the first expanded operation on Thursday it accepted about $5.19 billion against a $6 billion maximum, one of the few times in more than fifty such operations since 2024 that it took less than the ceiling. Separately, Wednesday’s $22 billion thirty-year auction cleared at a high yield of 5.308 percent with unusually strong end-investor demand, as primary dealers absorbed only 2.2 percent of the issuance against an 11.5 percent average and international bidders took about 79.5 percent. The market interpretation is that larger buybacks may ease supply pressure at the long end. The framework’s interpretation is more specific: yields staying elevated even alongside a strong auction and an expanded buyback is evidence about the scale of the structural forces pushing long-term borrowing costs higher, not evidence that individual sales are failing to clear.
Gold and silver are not telling the same story, and silver’s higher beta is the reason. On the prior day’s hot PPI, silver fell roughly three to four percent in a session while gold fell closer to one and a third percent, and silver has since dropped below $64, pushing the gold-silver ratio to about 67. Silver is both a monetary metal and an industrial input, which makes it more sensitive to rate and growth expectations and gives it a sharper reaction in both directions. The framework does not read the deeper drop as a weaker structural case for silver, because silver’s supply picture is a separate and longer story, covered below.
The structural buyer strengthened even as the price fell. China’s central bank added about 20 tonnes of gold in August, its largest monthly purchase since October 2023 and a twenty-second consecutive month of accumulation, buying into the price weakness. Central banks bought a record 288.9 tonnes in the second quarter, and the World Gold Council’s 2026 survey found that 89 percent of reserve managers expect official gold holdings to keep rising over the next year. This is strategic reserve-management demand that operates on a multi-year diversification schedule, and it is the reason the framework treats the current pullback as cyclical rather than a change in the underlying condition.
Key Signals at a Glance
Gold is on track for a third straight weekly decline, down roughly two percent, having tested $4,300 and traded near $4,330, well below its January record near $5,405. The cause is the rate-and-dollar channel, not a change in the fiscal thesis.
August producer prices came in hot on the headline at 5.4 percent annually but softer on core at 0.2 percent monthly. The dollar firmed, the ten-year Treasury yield sits near 4.95 percent, and oil is above $100 on the US-Iran conflict.
This issue was finalized ahead of the August CPI release, the last inflation reading before the September 16 Fed meeting. At the research cutoff, consensus was roughly 0.4 percent monthly and 3.4 percent annual on the headline, with core near 0.2 to 0.3 percent monthly and about 2.4 percent annual, and futures priced a September hike toward 60 to 70 percent. The framework treats the print as a scenario variable, set out below.
The Treasury accepted about $5.19 billion at Thursday’s first expanded buyback against a $6 billion maximum, while Wednesday’s $22 billion thirty-year auction cleared with strong end-investor demand, dealers taking only 2.2 percent against an 11.5 percent average. Yields have stayed elevated regardless, which speaks to structural pressure on long-term borrowing costs rather than failed individual sales.
Silver has fallen far harder than gold, roughly three to four times as much on the PPI print, dropping below $64 and lifting the gold-silver ratio to about 67. Its higher beta cuts harder on hawkish moves. Its structural supply deficit is a separate, longer story.
The structural buyer strengthened as the price fell: China’s central bank bought about 20 tonnes in August, its most since 2023 and a twenty-second straight month, while central banks bought a record 288.9 tonnes in the second quarter.
The Picture in One Chart
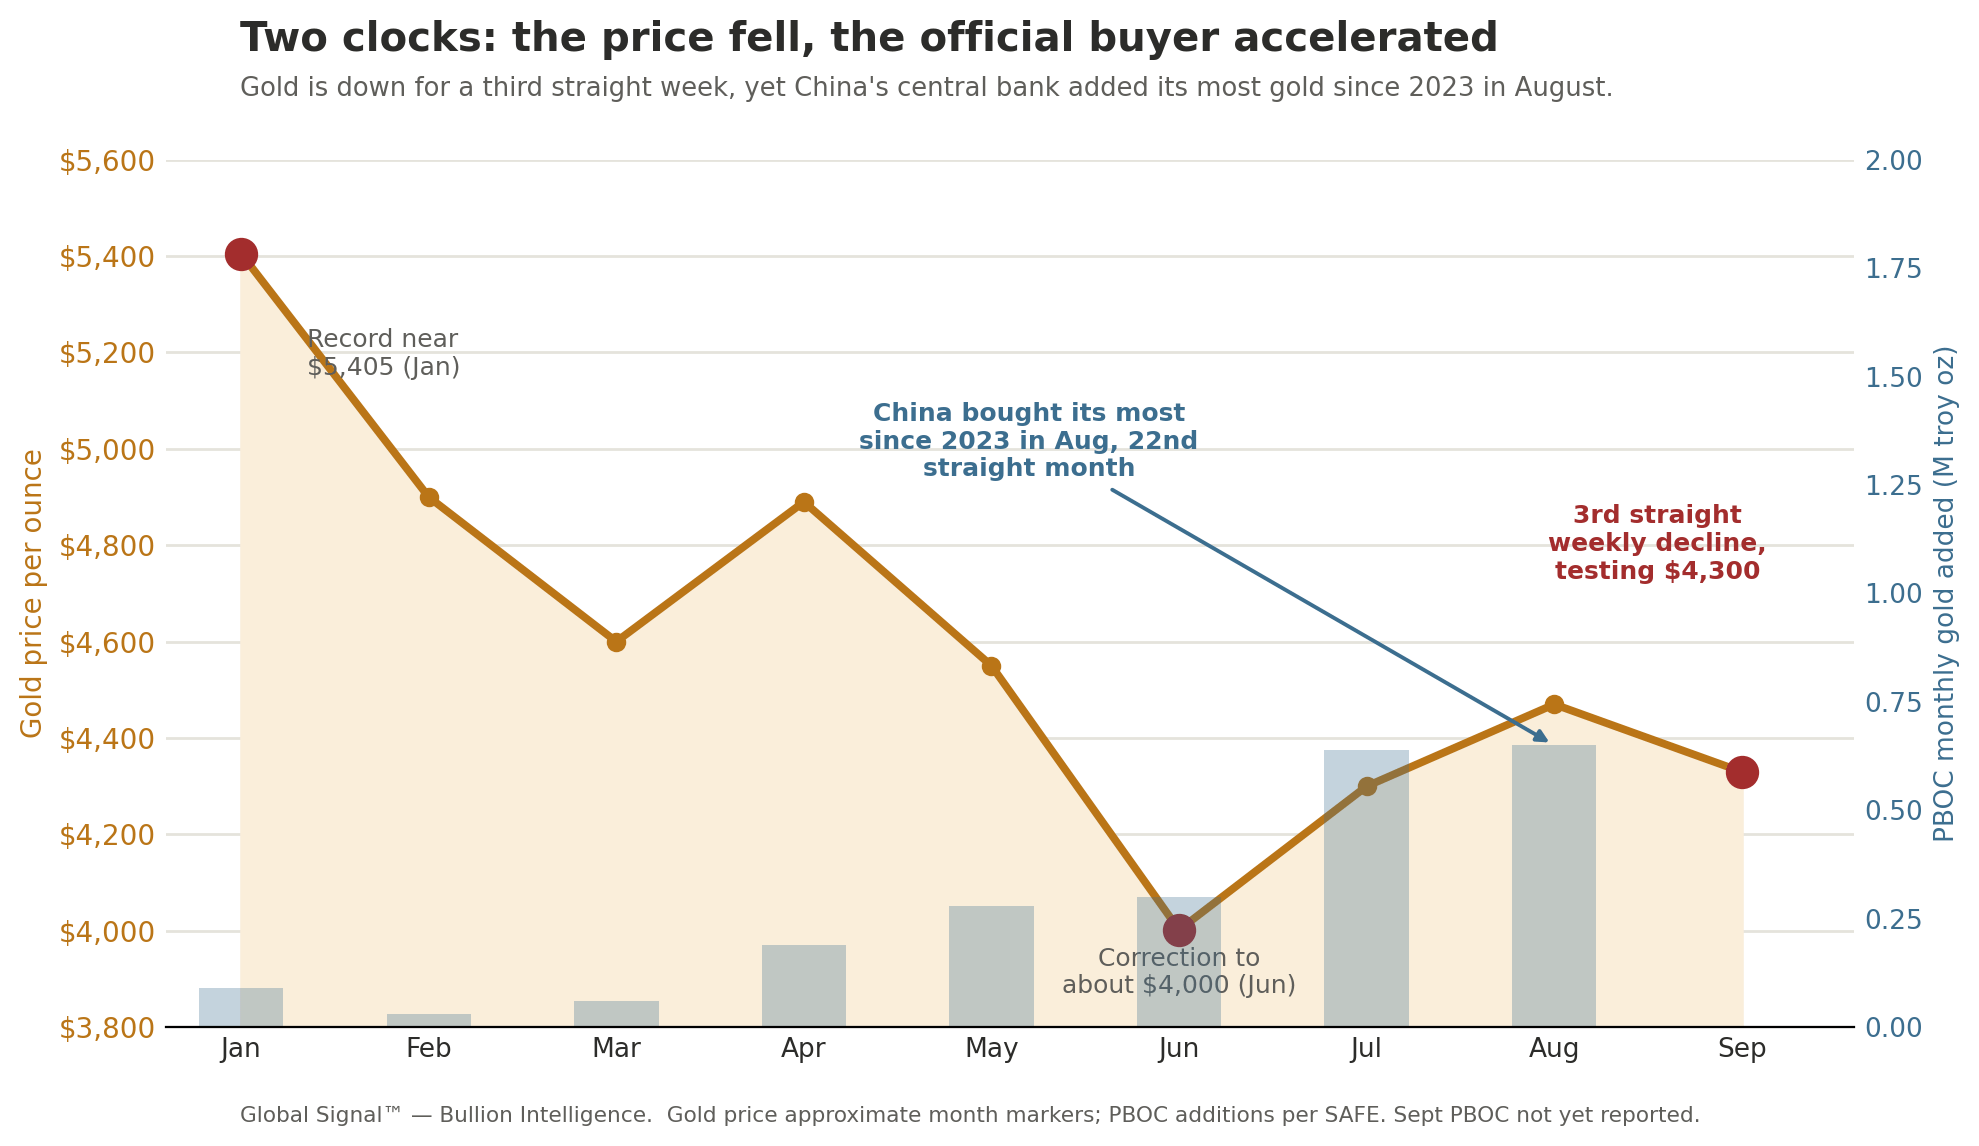
The chart sets gold’s price through 2026 against the monthly gold purchases of China’s central bank, and the contrast is the point. Gold’s price is volatile and, lately, falling for a third straight week as the rate cycle turns against it. The central bank’s buying, shown in the bars, has done the opposite, rising to its largest monthly total since 2023 even as the price pulled back. The two are moving in different directions because they answer to different things. The price responds to rate expectations, the dollar, and positioning, all of which can turn against gold in a single week. The official buying responds to a multi-year decision to hold more gold and fewer dollars, a decision that treats a rate-driven dip as a chance to add rather than a reason to stop. What the reader should notice is simply that the divergence is unusually wide right now, with the tactical money selling the rate cycle while the largest official buyer keeps accumulating through it.
Everything above is yours, permanently. What follows is the research layer.
The conviction framework and the reasoning behind each position, the named instruments that express each thesis, forward scenarios with confidence tiers, the Cycle & Cosmos read, and the watch conditions that would change the framework’s stance.
Free explains what is moving the market. Premium maps where the evidence points — and the conditions that would change it.
Seven-day free trial. Read one complete issue with the research layer intact, then decide.
Global Signal™ is independent research. It is not investment advice and does not account for your circumstances.
