


For three months, this letter has been telling you the same thing about gold’s decline: it was being driven by two temporary forces — a hawkish Federal Reserve and a soaring dollar — and that when those forces faded, the price would follow the fundamentals back up. This week, for the first time, we got real evidence that the fading has begun. And it came from an unexpected place: the job market.
Let me set the scene, because the turn this week only makes sense against how bad the quarter was. Gold just closed out its worst quarter since 2013. From its January peak near $5,595 an ounce, it fell all the way below $4,000 in late June — a drop of roughly 28% at the lows — as new Fed chairman Kevin Warsh came in tougher on inflation than anyone expected and the dollar climbed to a 14-month high. Silver was hit even harder, falling below $60 and spending weeks pinned there. If you held metal through the spring, this was a genuinely painful stretch, and I’m not going to pretend otherwise.
Then two things happened in the space of 48 hours that started to change the picture.
First, on Wednesday, Warsh gave a speech in Portugal that markets read as a real softening. He noted that the Fed’s preferred underlying inflation measure — the trimmed-mean PCE — has now fallen year-over-year for 36 straight months, which is a quiet way of saying the inflation fight may be closer to won than the headlines suggest. Gold jumped over 2% and silver surged nearly 4% on the day, their best session in weeks, as the dollar pulled back from its highs.
Then, on Thursday, the June jobs report landed — and it was a shock. The economy added just 57,000 jobs, against expectations of 110,000, the weakest in four months. Worse, the prior two months were revised down by a combined 74,000. After three straight months of a red-hot labor market that kept the Fed aggressive and gold suppressed, the job market suddenly looks like it’s cracking. And a cracking job market is exactly the thing that forces the Fed to stop worrying about inflation and start worrying about the economy — which is precisely the shift gold has been waiting for.
This is an in-depth issue, because this is a genuine inflection point and it deserves the full treatment. Let me walk you through what happened, why the jobs report matters so much, where silver’s extraordinary setup stands, what the world’s central banks just told us, and how a patient holder should think about this moment.
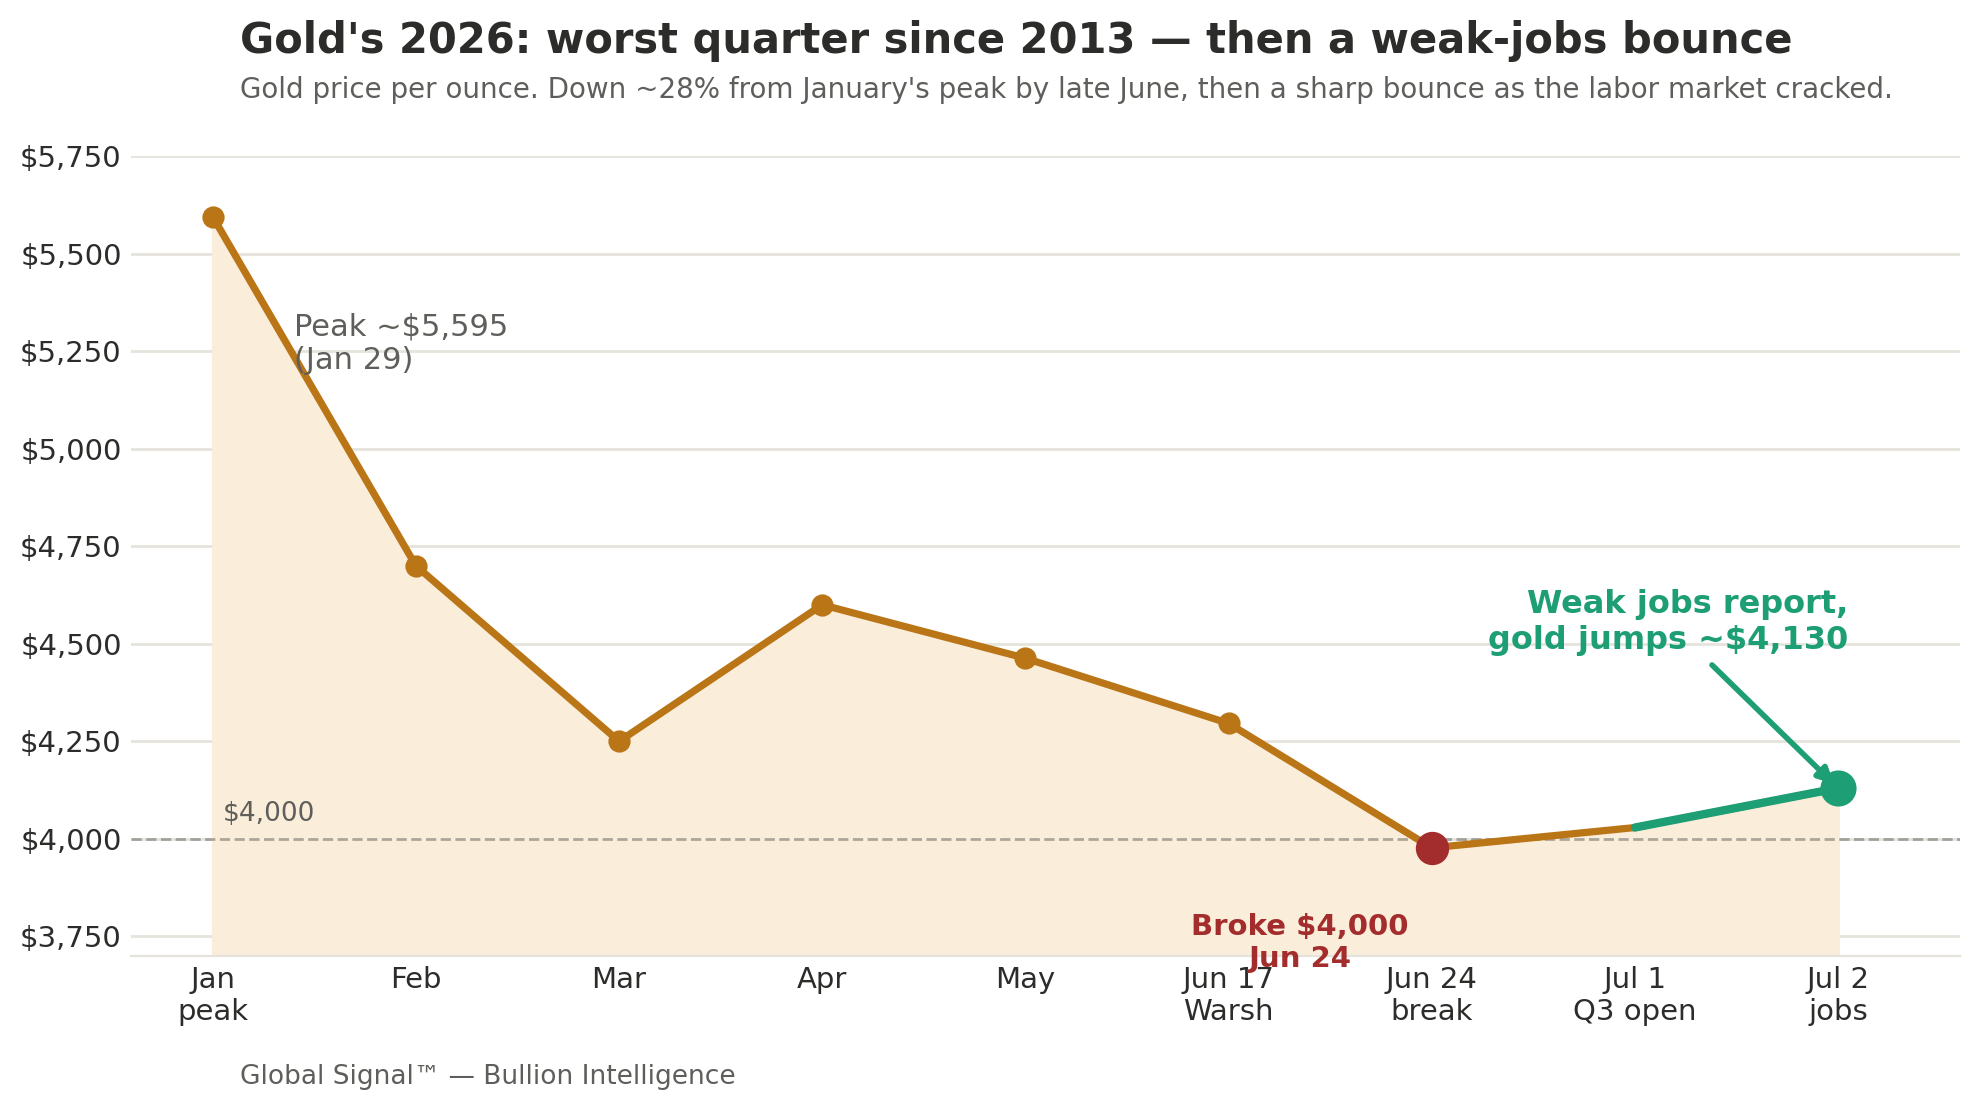
The Picture in One Chart
The chart above tells the whole story of gold’s 2026. The peak near $5,595 in late January. The long, grinding decline through the spring as the Iran war drove up inflation and Warsh’s Fed turned hawkish. The break below $4,000 in late June — that red dot, the worst quarter since 2013. And then, at the very end, the green dot: gold jumping back toward $4,130 as the job market cracked and the rate-hike fears began to lift. That last move is small on the chart, but it may be the most important turn of the year, because of what caused it.
Opening Signal
Here’s the single most important thing to understand this week: the force that has been crushing gold all year just started to reverse, and it reversed for a reason that tends to last.
All year, gold’s enemy has been the fear of higher interest rates. When the Fed is hawkish and rates are high or rising, gold — which pays no interest — becomes less attractive next to a Treasury bond or a savings account, and the dollar strengthens, which pushes gold down further. That’s the machine that drove gold from $5,595 to below $4,000.
What breaks that machine is a weakening economy, because a weakening economy forces the Fed to stop raising rates and start thinking about cutting them. And this week, for the first time all year, the economy flashed real weakness: 57,000 jobs when 110,000 were expected, with prior months revised sharply lower. The market’s response was immediate and telling — traders pushed their bets for the next rate hike from September all the way out to December, and some began questioning whether the Fed will hike at all. The dollar fell. Gold rose. This is the machine starting to run in reverse.
The reason this matters more than a normal up-day is that it’s fundamental, not technical. Gold didn’t bounce because of a chart pattern or a headline. It bounced because the underlying economic story that justifies its decline is beginning to change. That’s the kind of turn that can mark a bottom.
Executive Signal — Premium
The hawkish-Fed headwind is finally starting to lift, and that’s the quarter’s most important development. For three months, the single biggest force pushing gold down was the expectation of Federal Reserve rate hikes, cemented by Warsh’s hawkish debut and a string of hot economic data. This week that expectation cracked. Warsh’s Sintra speech acknowledged that underlying inflation has been falling for 36 straight months, and the shockingly weak June jobs report (57,000 versus 110,000 expected, with 74,000 in downward revisions to prior months) forced markets to push rate-hike bets from September to December. The dollar fell from its 14-month high. This is the exact catalyst gold has been waiting for, and it’s arriving just as the metal sits at its most oversold levels of the cycle.
The quarter was genuinely brutal, and honesty requires naming it. Gold fell roughly 28% from its January peak to its late-June low, its worst quarter since 2013, driven by the hawkish Fed and a dollar surge. Silver fell even harder, breaking below $60 for the first time since December and staying there. Several Wall Street banks cut their near-term targets. This was the deepest drawdown of the entire cycle, and anyone holding metal felt it. The turn this week is meaningful, but it’s the first turn, not a confirmed trend — a genuine bottom takes time to build and confirm.
The structural floor was reconfirmed at the exact bottom, which is the pattern that matters. As gold broke below $4,000, the World Gold Council’s annual survey landed with a striking message: 89% of central banks expect global gold reserves to keep rising over the next year, and a record share plan to add to their own holdings. China’s gold imports tripled in Q1 to 317 tonnes, and the People’s Bank of China ramped its reported buying to eight tonnes in April. The most patient, most informed buyers on earth used this weakness to accumulate — the same pattern we’ve documented all cycle. The paper price fell; the physical floor got stronger.
Silver’s setup is the most compelling in the entire metals complex, and it just got a catalyst. Silver fell harder than gold during the correction, pushing the gold-to-silver ratio up toward 67, but it’s now in its sixth consecutive year of supply deficit, with total supply at a decade high yet demand still outpacing it. When the monetary headwind eased this week, silver immediately outran gold — up 3.75% versus gold’s 2.27% on Warsh’s speech — exactly as it tends to do when rate fears fade. A structurally undersupplied metal at a deep discount, catching a monetary tailwind, is the highest-conviction setup we’ve covered.
For the patient holder, this is the moment the thesis has been building toward. The temporary forces that drove the correction are fading, the structural floor is confirmed at record-strong levels, silver offers the deeper value, and the every-major-bank year-end targets ($4,900 to $6,000) sit far above today’s price. The turn isn’t confirmed yet, but the evidence that it’s beginning is now real rather than hoped-for.
Key Signals at a Glance — Premium
The June jobs report shocked: just 57,000 jobs added vs. 110,000 expected, the weakest in four months, with prior months revised down 74,000. The labor market is visibly cooling for the first time this year.
Gold jumped to ~$4,130 (+2.27%) and silver to ~$61.73 (+3.75%) on the week’s turn, their best session in weeks, as the dollar fell from a 14-month high and rate-hike bets moved from September to December.
The trigger was two-fold: Warsh’s Sintra speech noting the Fed’s trimmed-mean PCE has fallen year-over-year for 36 straight months, plus the weak jobs data — together easing the hawkish-Fed headwind that drove the correction.
The quarter was gold’s worst since 2013 — down ~28% from the January peak of $5,595 to below $4,000 in late June. Silver fell even harder, below $60 for the first time since December.
The structural floor reconfirmed at the bottom: 89% of central banks expect global reserves to rise, a record share plan to add, and China’s Q1 gold imports tripled to 317 tonnes.
Silver’s setup stands out: 6th straight year of supply deficit, decade-high demand, and it outran gold on the turn — the classic pattern when monetary headwinds ease. Every major bank’s year-end gold target ($4,900–$6,000) sits far above spot.
The real positioning map starts below →
Conviction map, named vehicles for each thesis, forward scenarios with confidence tiers, the Cycle & Cosmos read, and the Watch Triggers for the weeks ahead — in the Premium Subscription. Premium subscribers see this on publish day. Free subscribers receive it 7 days later.
Market Breakdown — Premium
This Week’s Pulse
Gold sits near $4,130 after its best week in over a month, having bounced hard off the sub-$4,000 lows on the Warsh speech and the weak jobs report. Silver is near $61.73, having surged nearly 4% on Thursday and outpacing gold — a meaningful tell. The gold-to-silver ratio compressed to about 66.9 as silver led. The 10-year Treasury yield eased and the dollar fell from its 14-month high, both tailwinds for metal. The June jobs shock (57,000 versus 110,000 expected) was the catalyst, pushing rate-hike expectations from September to December and reviving the case for gold. Oil remains near pre-war levels as the Iran de-escalation holds, which is helping cool the inflation that drove the Fed hawkish. After a brutal quarter, the tone has shifted from relentless selling to the first genuine sign of a turn — though one good week doesn’t undo three bad months, and confirmation will take time.
How Bad the Quarter Really Was
It’s worth being honest and specific about the damage, because context makes the turn meaningful. Gold peaked at $5,595 on January 29 and fell to below $4,000 by late June — a decline of roughly 28% at the lows, the worst quarterly performance since 2013. The causes were specific and identifiable: the Iran war drove oil and inflation up in the spring, which killed the market’s expectation of Fed rate cuts; then Warsh took over as Fed chair and delivered a hawkish first meeting, raising inflation forecasts and signaling possible rate hikes; and the dollar surged to a 14-month high as a result. Silver, being both a precious and an industrial metal and far more volatile, fell even harder, breaking below $60 for the first time since December. Several major banks — Goldman, others — trimmed their near-term targets. This was capitulation-grade pain, the deepest of the cycle.
Why This Week’s Turn Is Different
What separates this week’s bounce from the handful of failed bounces during the correction is the cause. The earlier bounces were technical — oversold rallies that faded because the underlying story hadn’t changed. This one is fundamental. The weak jobs report doesn’t just lift sentiment; it changes the Fed’s calculus. A central bank cannot keep threatening rate hikes into a visibly weakening labor market without risking a recession, and Warsh’s own words this week — acknowledging 36 straight months of falling underlying inflation — suggest the Fed is already looking for the exit from its hawkish stance. When the fundamental driver of a decline reverses, the bounce has a foundation the earlier ones lacked. That’s why this one deserves attention.
Macro Undercurrents — Premium
Five forces are working under the surface, and they’re finally starting to align in gold’s favor.
The labor market crack is the fulcrum, and it changes the whole story. For three months, a hot job market gave the Fed cover to stay hawkish and kept gold suppressed. The June report — 57,000 jobs, a four-month low, with heavy downward revisions to prior months — is the first hard evidence that the labor market is cooling. This matters enormously because employment is the Fed’s other mandate; a weakening job market shifts the Fed’s attention from fighting inflation to protecting growth, which is the pivot that historically turns gold from headwind to tailwind. One report isn’t a trend, but it’s the first data point pointing the direction gold needs.
The inflation picture is quietly improving beneath the scary headline. The headline inflation number has been high — 4.1% recently — but that’s largely the lingering effect of the oil shock, which is now reversing as oil returns to pre-war levels. Underneath, Warsh himself pointed to the trimmed-mean PCE falling for 36 straight months, and core measures have been decelerating month over month. If inflation cools as the oil shock fully rolls off, the Fed’s last reason to stay hawkish disappears, and the path opens for the rate relief that would powerfully support gold. The improving inflation trend is the second force turning in gold’s favor.
The dollar’s rollover is the mechanical tailwind, and it just began. The dollar hit a 14-month high during the correction, and a strong dollar is one of gold’s most direct headwinds because gold is priced in dollars — a stronger dollar makes gold more expensive for the rest of the world and pushes the price down. This week the dollar fell from its high on the weak jobs data and Warsh’s softer tone. If the dollar has peaked and begins a sustained decline as rate-hike bets fade, that alone is a significant tailwind for gold, independent of everything else. Watch the dollar; it’s the cleanest real-time gauge of the turn.
The central bank floor was reconfirmed at record-strong levels. Through the entire correction, the world’s central banks kept buying, and their intentions just hit new highs: 89% expect global reserves to rise, and a record share plan to add. The strategic driver is unmistakable — since the freezing of Russian reserves in 2022, nations have understood that dollar assets can be sanctioned, and they’re systematically diversifying into gold, which can’t be. China is the clearest example, tripling its Q1 gold imports to 317 tonnes as part of a long-term project to build a credible alternative to the dollar-centric system. This is the structural bid that sets the floor, and it’s stronger now than when the correction began.
The silver shortage is the coiled spring underneath it all. While the macro forces drive the day-to-day price, silver’s physical story keeps tightening: a sixth straight year of supply deficit, with 2026 supply at a decade high of 1.05 billion ounces yet demand still outpacing it, and above-ground stockpiles drawn down dramatically since 2021. Roughly 70% of silver is mined as a byproduct of other metals, so supply barely responds to price. A structurally undersupplied metal that just caught a monetary tailwind is the setup with the most explosive upside if the turn holds.
Smart Money — Premium
Three institutional patterns define the moment.
The central banks bought the exact bottom, which is what smart money does. The most important institutional behavior of the quarter was that the world’s central banks kept accumulating gold straight through the worst drawdown since 2013, and their forward intentions rose to record levels even as the price bottomed. Buying weakness when others panic is the definition of informed, patient capital, and the survey confirms that’s precisely the posture of the official sector. When the biggest and most strategic buyers on earth use a 28% correction to add rather than flee, they’re telling you they see the decline as temporary and the structural case as intact.
The banks held their high year-end targets through the correction, signaling how they read it. Despite the brutal quarter, JPMorgan maintains a year-end target near $6,000, Goldman holds $4,900, and a range of other institutions — Commerzbank, Barclays, UBP, TD — sit between $4,700 and $6,000. Metals Focus explicitly does not subscribe to the view that Fed rate hikes are likely over the next 12 months, underpinning a constructive outlook. When the analysts who set price targets watch gold fall 28% and keep their numbers 25-45% above spot, they’re telling you they see this as a correction inside an intact bull market, not a top. Their conviction at the lows is information.
The honest counter-signal: some desks turned cautious, and that deserves weight too. Balance requires noting that not everyone is bullish. Goldman cut its target from $5,400 to $4,900 on the more hawkish Fed. OCBC and Macquarie have argued for range-bound-to-lower prices through 2026 as real yields stay elevated, with Macquarie even forecasting gold to decline gradually toward 2030. The bear case is coherent: if the labor market crack proves to be noise and the Fed stays hawkish against sticky inflation, gold could retest or break its lows. This week’s turn tilts the odds toward the bulls, but the cautious voices are a reminder that one jobs report doesn’t settle the debate. Hold both views.
Conviction Map — Premium
Overweight — physical gold and silver in allocated form, silver-weighted given its deeper discount and the supply deficit, gold and silver royalty and streaming names, and quality producers. The turn this week strengthens the case; the correction created the entry.
Tactical — this is the highest-conviction accumulation zone of the cycle, with a genuine catalyst now in play. Accumulate in tranches — gold has reclaimed $4,000 and silver is trying to escape the $55-61 range. Add on any pullback that holds above the recent lows; the risk/reward has improved materially with the Fed headwind fading.
Underweight — leveraged paper positions that get shaken out at the lows (this quarter showed why), unallocated accounts where you don’t own real metal, and weak miners that can’t survive a prolonged soft patch.
Hedges — physical metal remains the core hedge against the fiscal and currency-debasement story that the record central bank buying keeps confirming. Hold the structural allocation through any remaining volatility, and treat the dollar’s rollover as the confirmation signal to watch.
Portfolio Playbook — Premium
The cleanest expressions of the thesis, grouped by role. The emphasis leans silver-heavy given the deeper discount and the supply story.
Physical and core exposure:
IAU (iShares Gold Trust) — low-fee core gold exposure, simple to hold in any brokerage account
SIVR (abrdn Physical Silver Shares) — physically-backed silver at a competitive fee, clean exposure to the deeper discount
PSLV (Sprott Physical Silver Trust) — fully allocated, redeemable physical silver for those who want delivery optionality
Royalty and streaming — the lower-risk way to own miners:
FNV (Franco-Nevada) — the largest, most diversified gold royalty, built to weather soft-price stretches
WPM (Wheaton Precious Metals) — silver-weighted royalty leverage, the cleanest play on a silver recovery and the record supply deficit
RGLD (Royal Gold) — a focused, financially disciplined royalty name
Producers and broad exposure:
AEM (Agnico Eagle) — a premier, low-cost gold producer with a strong balance sheet
PAAS (Pan American Silver) — a quality silver producer with real leverage to a silver repricing
GDX (VanEck Gold Miners ETF) — a diversified basket of major miners for one-ticket exposure
How to use the moment: the weak jobs report and Warsh’s softer tone are the first real evidence that the Fed headwind is lifting, which makes this the highest-conviction accumulation zone of the cycle. Buy in tranches rather than all at once — one jobs report isn’t a confirmed trend — and lean silver-heavy given the deeper discount and the supply deficit. The central banks bought this bottom; patient holders can accumulate alongside them.
Cycle & Cosmos — Premium
A Common-Sense Guide for Investors
Let me share something about this week that has an almost poetic quality to it, because it captures a truth about markets that’s worth carrying with you.
For three months, gold suffered because the economy looked too strong. A hot job market, a hawkish Fed, a soaring dollar — the very picture of economic strength kept pushing gold down. And then this week, gold rose because the economy looked weak. A cracking job market, a softening Fed, a falling dollar. The same force that punished gold on the way up rewarded it on the way down. That inversion — where bad news becomes good news — is one of the deepest rhythms in all of markets, and understanding it is the difference between panic and patience.
Gold is the mirror, not the picture. Here’s the thing to understand about gold that most people never quite grasp: gold doesn’t reflect how the economy is doing — it reflects what the economy’s condition does to the value of money. When the economy runs hot and rates rise, money earns more, and gold, which earns nothing, looks worse by comparison. When the economy cracks and the Fed has to ease, money earns less, the dollar weakens, and gold shines. So gold often does its best when the news is at its worst. It’s the mirror that shows you the opposite of the room. This week the room got scarier — a weakening job market — and the mirror brightened. That’s not a paradox; it’s gold’s nature.
Winter was the setup, not the ending. We’ve talked in this section about how markets move in seasons, and gold just lived through a hard winter — its worst quarter in over a decade. But here’s what the seasons teach: winter isn’t the end of the story, it’s the setup for spring. The 28% correction shook out the impatient, the leveraged, and the weak-handed. It transferred gold from people who were nervous to people — the central banks — who think in decades. That transfer, painful as it was, is exactly what builds the foundation of the next advance. The colder the winter, the more thoroughly the ground gets cleared. This was a cold one.
The whole cycle is pointing the same direction it always was. Step back from the quarter and remember where we are: inside that 2025-2027 window where the old debt-based financial order gets tested and real, tangible assets reassert their ancient role. A brutal correction inside that window doesn’t contradict it — it’s how these things always go, with sharp shakeouts punctuating a long structural climb. The central banks buying record amounts of gold while the price fell is the deep current showing you which way the tide truly runs, regardless of the waves crashing on the surface. Government debt past $37 trillion, a dollar being deliberately diversified away from, gold being hoarded by nations — none of that changed this quarter. Only the price did.
The takeaway. Don’t let a hard winter convince you spring isn’t coming. This week gold reminded us of its deepest nature — it rose precisely when the economic news turned dark, because that darkness is what forces the Fed to ease and the dollar to fall. The correction was the winter that cleared the ground and moved the metal into strong hands. The central banks are buying. The supply of silver keeps tightening. The bank targets sit far above today’s price. If gold and silver are your anchor through the turbulence ahead, a moment when the price is low and the fundamental winds are just beginning to shift back in your favor is a moment to add to the anchor, not abandon it. Watch the dollar and the next jobs report for confirmation, accumulate with patience, and remember: the mirror brightens when the room darkens.
What to watch right now:
The dollar — whether its rollover from the 14-month high continues, the cleanest real-time signal that the turn is real.
The next jobs and inflation reports — whether the labor-market crack is confirmed and inflation keeps cooling, which would cement the Fed’s pivot.
Whether silver keeps leading gold — when the scrappier metal outruns gold, the recovery is usually genuine.
Forward Scenarios — Premium
Turn-confirmed case — Medium-to-high confidence — The weak jobs report marks the fundamental turn. The labor market keeps cooling, inflation keeps easing as oil stays low, the Fed abandons its hawkish stance, and the dollar rolls over from its highs. Gold recovers through the second half toward the bank targets, silver leads powerfully on its supply deficit, and the correction is confirmed as the cycle low. Confirms if: the dollar keeps falling, the next jobs report is also soft, inflation cools, and gold holds above $4,000.
Choppy-bottoming case — Medium confidence — The turn is real but the path is bumpy. Gold bases in a $3,900-$4,300 range through the summer as the data sends mixed signals — some soft, some firm — and the Fed stays noncommittal. A frustrating but constructive period where patient accumulation is rewarded and the eventual recovery builds slowly. This is the most likely near-term path given that one jobs report isn’t a trend. Confirms if: the data is mixed, the dollar chops sideways, and gold holds its range.
Failed-turn case — Speculative — The weak jobs report proves to be noise (revised up next month), inflation re-accelerates on some new shock, and the Fed stays aggressively hawkish. The dollar resumes its climb, and gold retests or breaks its lows toward $3,800 before the structural buyers catch it. This would be a deeper generational entry, not a thesis break, given the intact central bank demand. Confirms if: jobs data is revised up, inflation re-accelerates, and the dollar makes new highs.
Watch Triggers — Premium
The US dollar index. Its rollover from a 14-month high on the weak jobs data is the cleanest real-time signal of the turn. Sustained dollar weakness is a powerful gold tailwind; a resumption of the climb would threaten the bounce.
The next jobs report and revisions. June’s 57,000 print is the first crack; confirmation next month (or an upward revision that erases it) determines whether the labor-market weakening is real. This is the single most important data point for the Fed’s pivot.
Inflation data as the oil shock rolls off. Whether headline inflation cools now that oil is back at pre-war levels. Cooling inflation removes the Fed’s last reason to stay hawkish and clears gold’s path.
The gold-to-silver ratio, near 67. Continued compression as silver leads confirms the recovery’s health. Silver outrunning gold is historically the signature of a genuine metals turn.
Fed communications into the July 29 meeting. Warsh’s Sintra tone softened; watch whether other Fed officials follow. Any further dovish shift accelerates gold’s recovery, while renewed hawkishness would stall it.
TL;DR — Premium
Gold just finished its worst quarter since 2013 — down ~28% from January’s $5,595 peak to below $4,000 in late June — driven by Warsh’s hawkish Fed and a dollar at a 14-month high. Then two things changed everything: Warsh’s Sintra speech noted underlying inflation has fallen for 36 straight months, and the June jobs report shocked at just 57,000 (vs. 110,000 expected) with 74,000 in downward revisions. Gold jumped to ~$4,130, silver surged to ~$61.73, the dollar fell, and rate-hike bets moved from September to December. The headwind that crushed gold all year is finally starting to lift.
The turn is fundamental, not technical — a cracking job market forces the Fed to stop fighting inflation and start protecting growth, the exact pivot gold needed. The structural floor was reconfirmed at the bottom: 89% of central banks expect reserves to rise, China tripled Q1 gold imports to 317 tonnes. Silver’s setup is the standout — 6th straight supply deficit, and it outran gold on the turn. Every major bank’s year-end target ($4,900-$6,000) sits far above spot. The honest caveat: one jobs report isn’t a confirmed trend, and some desks stay cautious.
Positioning: this is the highest-conviction accumulation zone of the cycle. Physical and quality miners — royalty (FNV, WPM, RGLD), producers (AEM, PAAS, GDX), physical (IAU, SIVR, PSLV) — silver-weighted. Accumulate in tranches; watch the dollar and the next jobs report for confirmation. The Cycle & Cosmos read: gold is the mirror that brightens when the room darkens — it rose this week precisely because the economic news turned dark. Winter was the setup, not the ending.
The job market cracked. For gold, that crack may be the light getting in.
— Written by The Global Signal Team
Global Signal™ is published for informational and educational purposes only. Nothing in this newsletter constitutes financial, investment, legal, or tax advice, nor a recommendation to buy, sell, or hold any security, asset, or strategy. The Cycle & Cosmos section is offered as interpretive and educational commentary only and makes no claim of causative effect on markets. All opinions are those of the author at the time of publication and are subject to change without notice. Markets involve risk, including possible loss of principal. Past performance is not indicative of future results. No client or advisory relationship is formed by reading this newsletter. Readers are solely responsible for their own decisions and should conduct independent research and consult a licensed professional before acting on any information. The author and publisher disclaim any liability for losses incurred based on this content. Full terms: https://globalsignalhq.substack.com/tos · © Global Signal™