

Last week I explained why gold had been falling on news that should have lifted it — because in 2026, gold trades on interest rates, not fear, and the war was pushing rates the wrong way. This week gave us the mirror image of that lesson, and it’s just as important to understand.
Here’s what happened. On Tuesday, the June inflation report came out, and it was genuinely good news. Headline inflation dropped to 3.5%, well below the 3.8% expected, with the steepest monthly decline since April 2020. Core inflation cooled to 2.6%. This was exactly what gold had been waiting for — softer inflation means less pressure on the Fed to raise rates, which means lower real yields, which is fuel for gold. And gold responded immediately, jumping about $90 to roughly $4,089, with silver popping too. For a day, it looked like the turn was finally here.
Then, over the next two days, gold gave almost all of it back. By Friday it had slid back toward $4,000, and silver had dropped to around $56. The good inflation news didn’t hold. And the reason it didn’t hold is the single most important thing for you to understand about this market right now, because it’s subtle and almost nobody is explaining it clearly.
The June inflation report told us about the past — it measured prices in June, when oil was cheap. But this week, oil was anything but cheap. The Iran conflict escalated again, with the US reinstating a naval blockade on Iranian shipping and reasserting control over the Strait of Hormuz, and oil climbed hard, with Brent pushing toward $87. So the market did something sophisticated: it looked at June’s good inflation number, then looked at July’s rising oil, and concluded that next month’s inflation is going to be worse. The market is now pricing forward inflation faster than the Fed can act on last month’s data. Gold rallied on the backward-looking good news, then surrendered the gains to the forward-looking bad news.
That tension — between what inflation was and what it’s about to become — is what’s holding gold hostage this summer. Let me walk you through it fully: why the rally faded, why silver just hit a genuinely remarkable level of cheapness, what China did again this month that tells you everything about the long game, and how a patient holder should think about a market caught between a cooling past and a heating future.
The Picture in One Chart
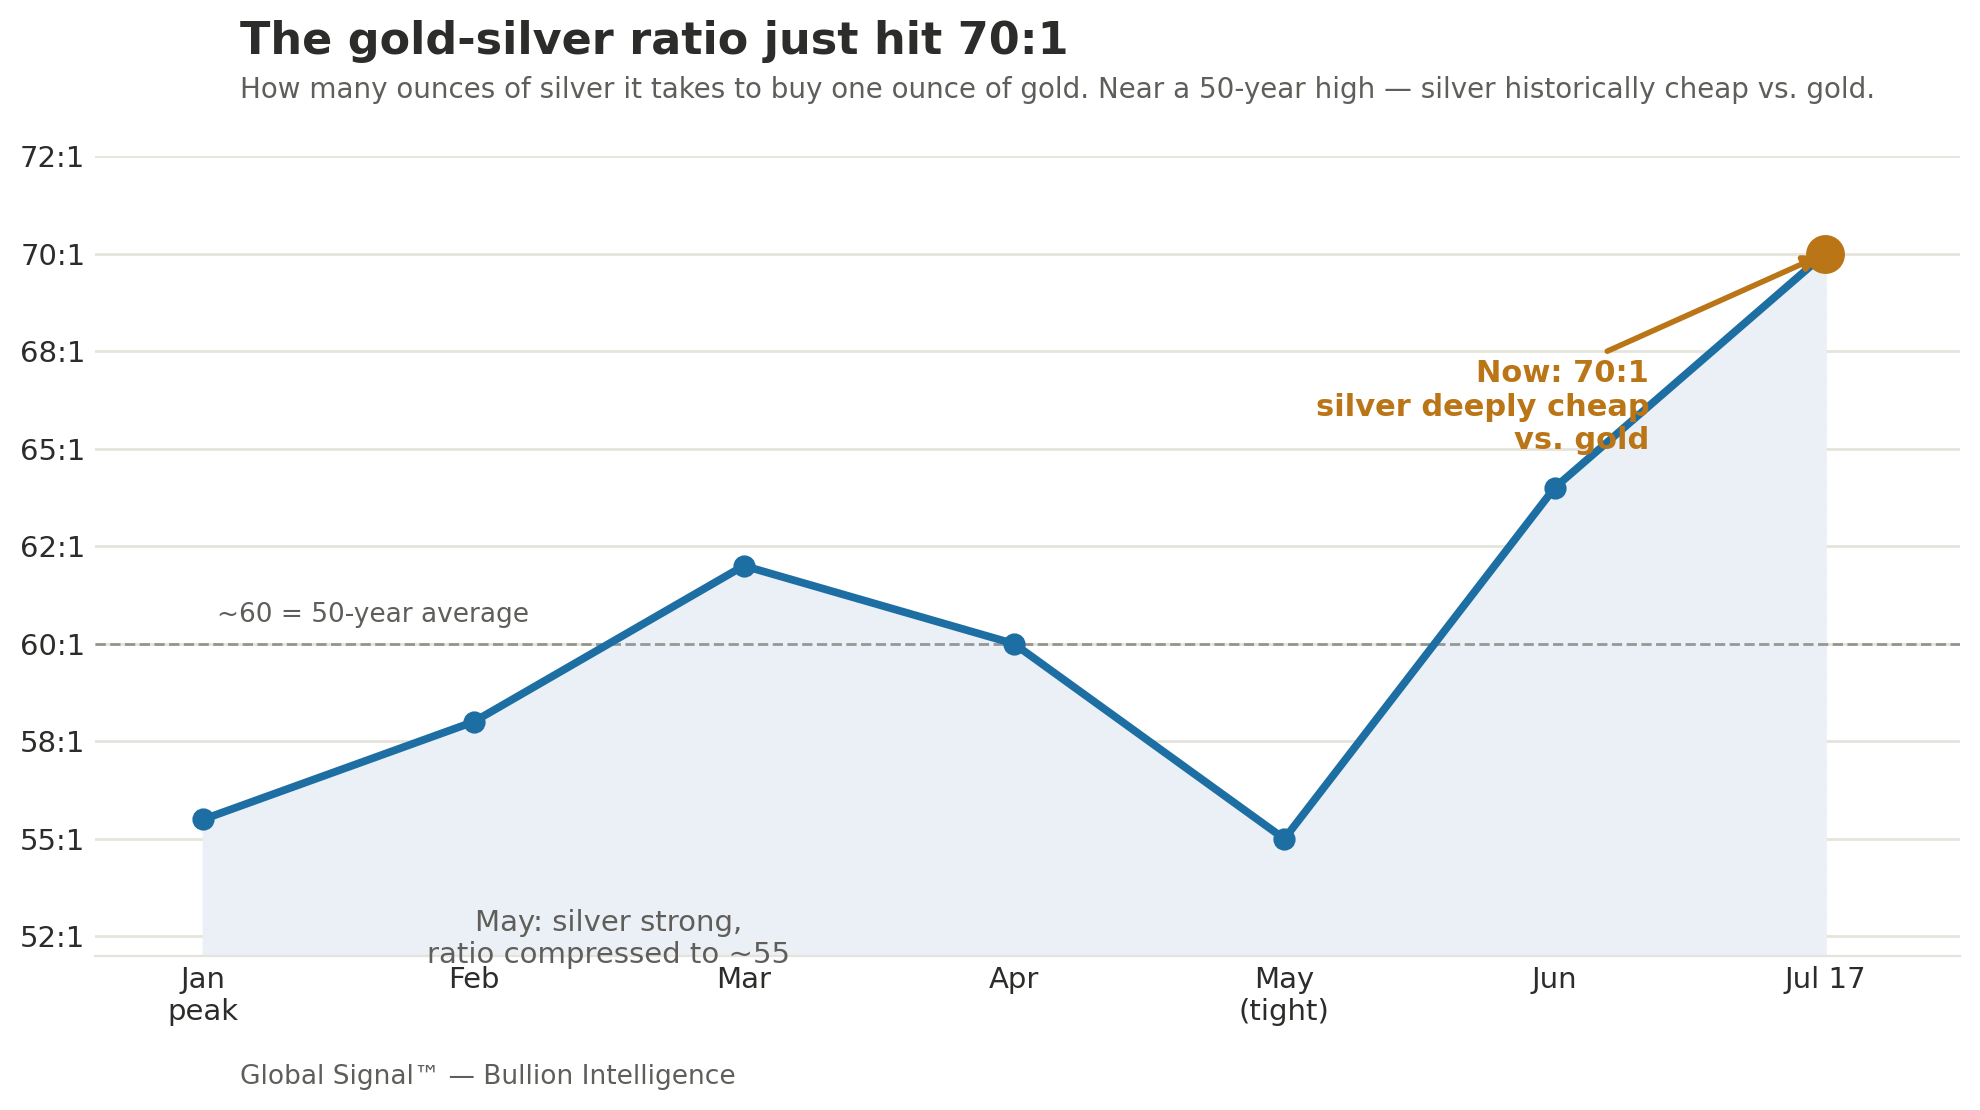
The chart above shows something worth understanding: the gold-silver ratio, which measures how many ounces of silver it takes to buy one ounce of gold. Back in May, when silver was strong, the ratio was compressed near 55. This week it blew out to 70 — meaning it now takes 70 ounces of silver to buy a single ounce of gold, near the high end of its range over the past fifty years. In plain terms, silver has gotten dramatically cheaper relative to gold. And history says that when this ratio stretches this far, it usually snaps back through silver outperforming — which is the opportunity hiding inside this week’s ugly price action.
Opening Signal
Here’s the heart of it: gold is trapped between good news about the past and bad news about the future, and the future is winning.
The good news about the past is real. June inflation cooled meaningfully, and if that were the whole story, gold would be climbing. Lower inflation means the Fed has less reason to raise rates, which lowers the real return on cash and bonds, which makes gold — that pays no interest — more attractive by comparison. That’s why gold jumped $90 the moment the number came out.
But the bad news about the future is also real, and it’s more powerful right now. The Iran war is escalating again, oil is spiking, and the market knows that today’s expensive oil becomes tomorrow’s expensive inflation. So even as June’s number looked good, traders started pricing in a worse July, kept the odds of a September rate hike alive, and pushed the dollar and bond yields back up — all of which pulled gold back down. The economy also refused to cooperate with the dovish story: retail sales came in solid and jobless claims fell to their lowest in ten weeks, showing the economy hasn’t weakened enough to force the Fed’s hand.
So gold is caught. The past says rates should ease; the future says they might not. Until that tension resolves — until we know whether the oil shock feeds through into sustained inflation or fades — gold is likely to stay range-bound, frustrating everyone. But underneath that frustration, the structural buyers keep accumulating, and silver has gotten cheap enough to be genuinely interesting.
Executive Signal — Premium
Gold rallied on backward-looking good news, then surrendered it to forward-looking bad news — and that mechanism is the whole story. June inflation came in soft on Tuesday (3.5% headline versus 3.8% expected, the steepest monthly drop since April 2020, with core at 2.6%), and gold jumped roughly $90 to about $4,089. But over the following two days it gave nearly all of it back, sliding toward $4,000 by Friday. The reason: the June data measured a month when oil was cheap, while this week’s renewed Iran blockade pushed Brent toward $87, and the market is now pricing the forward inflation that expensive oil implies faster than the Fed can act on last month’s improvement. Gold is trapped between a cooling past and a heating future.
The economy refused to weaken, which kept the rate-hike threat alive. Part of why the rally faded is that the data this week didn’t support the dovish case beyond the inflation print. Retail sales rose 0.2% in June, in line with expectations, and initial jobless claims fell by 8,000 to 208,000 — the lowest in ten weeks and well below expectations. A resilient economy gives the Fed room to stay hawkish if inflation re-accelerates. Markets still expect a hold at the July 29 meeting (odds near 90%), but the September meeting remains genuinely live, and that lingering hike threat is what keeps real yields elevated and gold pressured.
The gold-silver ratio hit 70:1, which is a genuine deep-value signal. Silver fell harder than gold again this week, pushing the ratio that measures their relative price to about 70 — meaning it takes 70 ounces of silver to buy one ounce of gold, near the top of its fifty-year range and well above the long-term average around 60. Silver gets hit twice because 58% of its demand is industrial (solar, semiconductors, EVs, AI data centers), so a hawkish Fed that threatens growth pressures silver’s industrial side on top of the monetary side that also weighs on gold. But history is clear: when this ratio stretches this far, it typically resolves through silver dramatically outperforming gold in the subsequent recovery. This is the tactical opportunity inside the week’s weakness.
China bought gold again, extending a streak that tells you everything about the long game. The People’s Bank of China added 14.93 tonnes of gold in June — its largest single-month purchase since October 2023 — extending its buying streak to twenty consecutive months, and it did this during gold’s worst quarterly decline since 2013. This is a multi-year reserve policy decision, not a reaction to any single data point. While Western traders sold gold on the rate fears, the most strategic buyer on earth kept accumulating. That divergence between the panicking paper market and the patient physical buyer is the defining feature of this entire correction.
The structural case is completely untouched by any of this week’s noise. US federal debt now exceeds $39 trillion with annual interest above $1 trillion, the fiscal backdrop that pushes nations toward gold hasn’t changed, and the institutional price targets remain far above spot — JPMorgan sees $4,800-$6,300 by year-end, Metals Focus targets $4,920. One soft inflation print didn’t make the case, and one faded rally doesn’t break it. The near-term is a rate story caught between oil and the Fed; the multi-year story is a debt-and-dedollarization story that grows stronger regardless.
Key Signals at a Glance — Premium
June inflation came in soft Tuesday (3.5% headline vs 3.8% expected, steepest monthly drop since April 2020; core 2.6%), and gold jumped ~$90 to ~$4,089 — then gave nearly all of it back by Friday, sliding toward $4,000.
The reason: June’s data measured a cheap-oil month, but the renewed Iran blockade pushed Brent toward $87 this week. The market is pricing forward inflation (from expensive oil) faster than the Fed can act on last month’s improvement.
The economy stayed resilient — retail sales +0.2%, jobless claims down to 208K (lowest in 10 weeks) — keeping the September rate-hike threat alive even as a July hold looks near-certain (~90% odds).
The gold-silver ratio hit 70:1, near a 50-year high (average ~60). Silver gets hit twice (58% industrial demand + monetary), but history says extreme ratios resolve through silver outperforming.
China’s PBoC bought 14.93 tonnes in June — largest since October 2023, 20th straight month — during gold’s worst quarter since 2013. The strategic buyer accumulates while Western traders sell.
The structural case is intact: US debt above $39T, interest above $1T/year. JPMorgan targets $4,800-$6,300 by year-end; Metals Focus $4,920; silver targets near $79-81 (implying a ratio back toward 50:1).
The real positioning map starts below →
Conviction map, named vehicles for each thesis, forward scenarios with confidence tiers, the Cycle & Cosmos read, and the Watch Triggers for the weeks ahead — in the Premium Subscription. Premium subscribers see this on publish day. Free subscribers receive it 7 days later.
Market Breakdown — Premium
This Week’s Pulse
Gold sits near $4,000-$4,040 after a volatile week that saw it rally to $4,089 on Tuesday’s soft inflation print, then fade back as forward inflation fears and a resilient economy reasserted. Silver is near $56, having touched $59 on the CPI pop before sliding, with the gold-silver ratio stretched to 70:1. The 10-year Treasury yield sits near 4.57% and the 2-year near 4.16%, both firm; the dollar index edged higher toward 100.5, a headwind for metal. Oil is the dominant force, with Brent near $87 on the renewed Hormuz blockade and continued US-Iran strikes — the single biggest weight on gold right now, because it drives the forward inflation fear. Transit through the Strait continues under severe hazards, neither normal nor fully blockaded. The market is caught between Tuesday’s good backward-looking data and the forward pricing that says July will look worse.
The Backward-Data vs. Forward-Pricing Mechanism
This is the concept worth slowing down on, because it explains everything confusing about this week. Economic data like the inflation report is always backward-looking — the June CPI released this week measured what prices did in June, when oil was cheap because the Iran ceasefire was holding. That’s why it came in soft. But markets don’t trade the past; they trade the future. And the future changed this week, because the ceasefire collapsed and oil spiked toward $87. So the market did something rational but subtle: it acknowledged that June was good, then immediately looked past it to a July that’s shaping up worse, because today’s expensive oil becomes next month’s expensive inflation. Gold rallied on the June data, then gave it back as the market repriced for a hotter July. The lesson: in a fast-moving environment, forward pricing overrides backward data, and right now the forward picture is being written in oil.
Why the Economy’s Strength Hurt Gold
The other half of the story is that the economy refused to roll over, and that’s a headwind for gold in this specific environment. Normally a strong economy and gold can rise together. But right now, gold needs the Fed to ease, and the Fed only eases if the economy weakens enough to force it. This week’s data cut the other way: retail sales were solid, and jobless claims fell to a ten-week low, signaling a labor market that’s still healthy. A healthy economy means the Fed has no urgent reason to cut and plenty of room to hike if inflation reaccelerates. So the good economic news became bad news for gold, because it kept the hawkish Fed threat alive. This is the same inverted logic we discussed last week — in 2026, gold often wants the news to be bad, because bad news is what forces the Fed’s hand toward the easing gold needs.
Macro Undercurrents — Premium
Five forces are working beneath the surface this week.
The oil-drives-forward-inflation mechanism is the master force right now. Everything traces back to oil. The renewed Iran blockade pushed Brent toward $87, and that single fact is what capped gold’s rally, kept the September hike alive, firmed the dollar, and pressured the whole complex. The reason is the forward-pricing dynamic: the market knows expensive oil today means expensive inflation tomorrow, so it’s pricing a hotter future regardless of how good June looked. As long as oil stays elevated on the conflict, the forward inflation fear keeps real yields up and gold contained. The moment oil falls — if the conflict de-escalates — the entire mechanism reverses and gold’s path clears. Oil is the variable to watch above all others.
The Fed’s September question is the live uncertainty, and it’s keeping metal pressured. A July hold is nearly certain, but September is genuinely undecided, with CME FedWatch pricing meaningful odds of a hike. This lingering uncertainty is itself a headwind, because it keeps real yields elevated and prevents the decisive dovish turn gold needs. Warsh’s testimony this week reinforced it — he called the soft inflation “one data point” and refused to declare victory, explicitly keeping a hike on the table. Until the September question resolves, gold lacks the clear catalyst to break higher, which is why the range-bound frustration is likely to persist into and through the July 29 meeting.
The silver setup is the standout opportunity, hiding inside the week’s weakness. Silver’s harder fall pushed the ratio to 70:1, near a fifty-year extreme, and the structural case underneath is compelling. Silver is in its sixth consecutive annual supply deficit at 46.3 million ounces, 58% of demand is industrial and growing (solar, semiconductors, EVs, AI data centers), and higher prices haven’t produced more supply because roughly 70% of silver is mined as a byproduct of other metals. So you have a metal in a persistent physical shortage, trading at a fifty-year cheapness relative to gold, held down mainly by short-term growth fears that a Fed pivot would erase. JPMorgan’s base case is $81 silver, implying the ratio compressing back toward 50:1 — a large move from here. When the monetary tailwind returns, silver’s higher beta and industrial leverage historically make it outrun gold significantly.
China’s relentless buying is the structural anchor, and it’s the tell that matters most. The PBoC’s twenty-month buying streak, extended in June with its biggest purchase since October 2023, is the clearest signal in the market. China is executing a multi-year strategy of diversifying away from the dollar and into gold, which can’t be sanctioned or frozen the way dollar reserves can. This buying is price-insensitive and strategic — it doesn’t stop for a bad quarter or a hawkish Fed. It’s why every dip toward $4,000 gets absorbed. The paper market sets the daily price through Western traders reacting to rate fears; the physical market sets the floor through sovereign buyers accumulating for the next decade. Over time, the floor wins.
The fiscal backdrop is the slow, immovable driver underneath everything. US federal debt above $39 trillion with interest payments over $1 trillion annually is the structural condition that makes gold matter, and it grows worse regardless of any week’s price action. This is what pushes central banks toward gold in the first place, and it’s why the institutional targets sit so far above spot. No single inflation print, hawkish or dovish, touches this. It’s the reason the multi-year case for gold strengthens even in a quarter when the price falls — the disease that gold treats is getting worse, not better.
Smart Money — Premium
Three institutional patterns define the moment.
China and the central banks bought the weakness, which is the textbook smart-money move. The most important institutional behavior remains the official sector’s continued accumulation straight through the worst drawdown since 2013. China’s twenty-month streak, extended in June, is strategic buying that ignores the daily price entirely. When the most sophisticated, most patient, most strategic buyers on earth use a 28% correction to keep accumulating at their fastest pace since 2023, they’re telling you what they believe gold is worth over the next decade — and it’s far above today’s price. This is the anchor beneath the whole market.
The institutional forecasters held their high targets through the volatility. Despite the faded rally and the range-bound frustration, the major desks kept their numbers: JPMorgan sees $4,800-$6,300 by year-end, Metals Focus targets $4,920, and silver targets cluster near $79-81 (LBMA consensus at $79.57). These forecasts explicitly assume the Fed eventually pivots as growth slows and that central bank buying provides structural support. The analysts who set price targets watched gold trade sideways-to-down and kept their bullish numbers, which tells you they read this as a pause within an intact bull market, not a reversal. Their conviction at these levels is information.
The honest counter-signal: the bear case has real advocates, and it deserves weight. Balance requires acknowledging it. OCBC expects gold to decline through year-end on rising yields, a stronger dollar, and weaker investor demand. Some technical forecasts point lower still if $4,000 breaks decisively, toward the $3,895-$4,000 zone or below. The coherent bear argument: if the oil shock feeds sustained inflation, the Fed hikes in September, the dollar strengthens further, and gold breaks its floor. This week’s failure to hold the CPI rally tilts slightly toward the bears in the near term. The structural buyers provide the floor, but a determined hawkish Fed could test it. Hold both views honestly.
Conviction Map — Premium
Overweight — physical gold and silver in allocated form, with an increased silver weighting given the 70:1 ratio and the deep-value setup, plus gold and silver royalty and streaming names and quality producers. The faded rally deepened the discount while the structural case held.
Tactical — this is a range-bound, frustrating market caught between oil and the Fed, which makes tranched accumulation the right approach — buy pieces on dips toward and below $4,000 rather than chasing the pops. The silver-heavy tilt is the highest-conviction expression here, given how stretched the ratio is. Keep dry powder for a possible break below $4,000 on a September hike scare.
Underweight — leveraged paper positions that get whipsawed out in exactly this kind of choppy, range-bound tape, unallocated accounts where you don’t own real metal, and weak miners that can’t endure a prolonged rate-driven soft patch.
Hedges — physical metal remains the core hedge against the $39 trillion debt-and-dedollarization story that China’s buying keeps confirming. Hold the structural allocation through the range-bound frustration, and treat the silver ratio at 70:1 as a signal to tilt toward silver within the allocation.
Portfolio Playbook — Premium
The cleanest expressions of the thesis, grouped by role. The emphasis this week tilts harder toward silver given the fifty-year cheapness signal.
Physical and core exposure:
IAU (iShares Gold Trust) — low-fee core gold exposure, simple to hold in any brokerage account
SIVR (abrdn Physical Silver Shares) — physically-backed silver at a competitive fee; the cleanest way to play the 70:1 ratio
PSLV (Sprott Physical Silver Trust) — fully allocated, redeemable physical silver for those who want delivery optionality
Royalty and streaming — the lower-risk way to own miners:
WPM (Wheaton Precious Metals) — silver-weighted royalty leverage, the cleanest play on the ratio compressing and the supply deficit
FNV (Franco-Nevada) — the largest, most diversified gold royalty, built to weather soft-price stretches
RGLD (Royal Gold) — a focused, financially disciplined royalty name
Producers and broad exposure:
PAAS (Pan American Silver) — a quality silver producer with real leverage to a silver repricing
AEM (Agnico Eagle) — a premier, low-cost gold producer with a strong balance sheet
GDX (VanEck Gold Miners ETF) — a diversified basket of major miners for one-ticket exposure
How to use the week: the faded CPI rally created a deeper, range-bound accumulation zone, and the 70:1 ratio is the standout signal — it argues for tilting the metal allocation toward silver, because when the ratio this stretched resolves, silver historically outperforms significantly. Accumulate in tranches given the choppy tape, keep powder for a possible dip below $4,000, and use the royalty names for resilience if the range persists. The central banks are buying the floor; patient holders can accumulate the discount alongside them.
Cycle & Cosmos — Premium
A Common-Sense Guide for Investors
Something happened this week that captures a truth about markets — and about life — worth sitting with. Gold got exactly the good news it had been waiting for, jumped for joy, and then, within two days, gave it all back. Not because the good news was fake, but because everyone was already looking past it to what comes next. And there’s real wisdom hiding in that little episode.
The market lives in the future, not the present. Here’s the thing most people get wrong: they think markets react to what just happened. They don’t. Markets react to what’s about to happen. This week, gold got a genuinely good inflation number about June — but the market barely paused on it, because it was already staring at July’s rising oil and thinking, “that’s going to make next month worse.” The past said celebrate; the future said brace. And the future won, because the future always wins in markets. The lesson for you as an investor is to train your eye forward — to ask not “what just happened?” but “what is the market already pricing about what’s next?” The people who see the future being priced before the crowd does are the ones who position well.
Watch what the patient giant does, not what the nervous crowd does. While the traders whipsawed gold up on Tuesday and down by Friday, reacting to every data point and oil headline, China’s central bank quietly did the same thing it’s done for twenty months straight: it bought more gold. It didn’t celebrate the good inflation number and it didn’t panic at the rising oil. It just kept accumulating on a schedule set by a decade-long strategy. That’s the difference between the nervous crowd and the patient giant. The crowd trades the noise; the giant accumulates through it. When you feel tossed around by the week-to-week swings, remember that the most strategic buyer on earth isn’t paying attention to any of it — and ask yourself which one you’d rather be.
The stretched rubber band always snaps back. Here’s the opportunity hiding in the frustration. Silver has gotten so cheap relative to gold that it now takes 70 ounces of silver to buy one ounce of gold — near the most stretched this relationship has been in fifty years. Think of it like a rubber band pulled unusually far. It can stay stretched for a while, and it can even stretch a bit more. But the further it pulls, the more energy it stores for the snap back. History says these extreme stretches resolve through silver surging to catch up. So while silver’s harder fall feels like the worse news this week, it’s actually where the coiled opportunity sits. The patient investor sees a stretched rubber band and understands that tension isn’t danger — it’s stored potential.
Where the long cycle still points. We remain inside that 2025-2027 window where the old debt-based order gets tested and real assets reassert their ancient role. A week where gold gets whipsawed by oil and rate fears while central banks keep accumulating and silver stretches to a fifty-year cheapness is exactly what that testing looks like — the surface churning while the deep current runs steady. The $39 trillion debt, the dollar being diversified away from, the relentless sovereign buying — none of it changed this week. Only the daily price did, and only within a range. The direction the deep cycle points is unchanged.
The takeaway. Don’t let a week where good news didn’t stick convince you the story is broken. Gold rallied and faded not because the case weakened, but because the market is looking forward at oil-driven inflation while the backward data improves — a tension that resolves the moment oil falls or the Fed pivots. Meanwhile the patient giant keeps buying, and silver has stretched to a fifty-year opportunity. If gold and silver are your anchor through the turbulence ahead, a frustrating, range-bound week with a stretched silver ratio is when you quietly accumulate — tilting toward the coiled rubber band of silver — not when you give up. Train your eye forward, watch the patient giant, and respect the stretched band. That’s the whole lesson.
What to watch right now:
Oil and the Strait of Hormuz — the master variable writing the forward-inflation story. Falling oil clears gold’s path; rising oil keeps it capped.
The gold-silver ratio at 70:1 — watch for silver to start outperforming, the signal that the stretched band is beginning to snap back.
The July 29 Fed meeting and the September question — the resolution of the rate uncertainty that’s keeping metal range-bound.
Forward Scenarios — Premium
Oil-falls-and-turns case — Medium-to-high confidence — The Iran conflict de-escalates, oil falls back, the forward-inflation fear fades, and the market can finally trade the improving backward data. Real yields ease, the September hike comes off the table, and gold breaks higher toward $4,300+ into the second half. Silver leads powerfully as the 70:1 ratio compresses, catching up on its supply deficit. The central bank floor holds throughout. Confirms if: oil falls below $75, the September hike odds drop, and the dollar rolls over.
Range-bound-grind case — High confidence near-term — The oil-and-Fed tension stays unresolved, and gold chops in a $3,900-$4,150 range through the summer while the market waits for clarity. Silver stays stretched near 70:1, frustrating but building the coiled setup. A frustrating, directionless period where patient tranched accumulation is rewarded and the central bank floor repeatedly defends $4,000. The most likely near-term path given the crosscurrents. Confirms if: oil stays volatile near $80-87, the Fed stays noncommittal, and the data stays mixed.
Oil-shock-and-hike case — Speculative — The conflict escalates further, oil breaks toward the spring peaks, the forward inflation becomes actual inflation, and the Fed hikes in September. The dollar strengthens, and gold breaks below $4,000 toward the $3,800-$3,895 zone before the structural buyers catch it. This would be the deepest discount of the cycle and a generational entry, not a thesis break, given China’s relentless buying. Confirms if: oil breaks above $90, the next inflation print reaccelerates, and the Fed signals or delivers a September hike.
Watch Triggers — Premium
Oil and the Strait of Hormuz. The master variable. It’s writing the forward-inflation story that’s capping gold, and it’s the single biggest swing factor. Falling oil on de-escalation clears gold’s path; sustained high oil on escalation keeps it pressured and could break $4,000.
The gold-silver ratio at 70:1. Near a fifty-year extreme. Watch for silver to begin outperforming gold on up days — that’s the signal the stretched ratio is starting to compress, historically the most powerful phase of a metals recovery.
The July 29 FOMC meeting and the September question. A July hold is near-certain, but watch the language for signals on September. Any dovish shift, especially if oil eases, would be a powerful catalyst; renewed hawkishness extends the range-bound pressure.
The next inflation data and whether the oil shock feeds through. June was soft but backward-looking. Whether July’s print reverses on the oil spike is the key test of the forward-pricing thesis and the Fed’s path.
Central bank buying data. China’s twenty-month streak is the structural anchor. Continued accumulation confirms the floor; any slowdown in the official-sector bid would be a meaningful warning sign to watch.
TL;DR — Premium
Gold got the good news it wanted this week — June inflation came in soft (3.5% vs 3.8% expected, steepest monthly drop since April 2020) — and jumped ~$90 to $4,089. Then it gave nearly all of it back within two days, sliding toward $4,000. The reason is the key lesson: June’s data measured a cheap-oil month, but this week’s renewed Iran blockade pushed Brent toward $87, and the market is pricing the forward inflation that expensive oil implies faster than the Fed can act on last month’s improvement. Gold is trapped between a cooling past and a heating future, and the future is winning. A resilient economy (solid retail sales, 10-week-low jobless claims) kept the September hike threat alive.
The standout opportunity: the gold-silver ratio hit 70:1, near a fifty-year high. Silver gets hit twice (58% industrial demand plus monetary), but history says extreme ratios resolve through silver dramatically outperforming — JPMorgan targets $81 silver, implying the ratio compressing toward 50:1. Meanwhile China bought 14.93 tonnes in June (largest since October 2023, 20th straight month) during gold’s worst quarter since 2013, and the structural case is untouched: $39T debt, JPMorgan’s $4,800-$6,300 year-end target.
Positioning stays overweight physical and quality miners — silver-tilted given the ratio — royalty (WPM, FNV, RGLD), producers (PAAS, AEM, GDX), physical (IAU, SIVR, PSLV). Accumulate in tranches given the range-bound tape; keep powder for a possible dip below $4,000. The Cycle & Cosmos read: the market lives in the future, not the present — gold faded because everyone’s looking past June’s good news at July’s oil. Watch the patient giant (China keeps buying), and respect the stretched rubber band (silver at 70:1 is coiled opportunity).
Good news came, gold jumped, then the future took it back. Understand why, and you understand the summer ahead.
— Written by The Global Signal Team
Global Signal™ is published for informational and educational purposes only. Nothing in this newsletter constitutes financial, investment, legal, or tax advice, nor a recommendation to buy, sell, or hold any security, asset, or strategy. The Cycle & Cosmos section is offered as interpretive and educational commentary only and makes no claim of causative effect on markets. All opinions are those of the author at the time of publication and are subject to change without notice. Markets involve risk, including possible loss of principal. Past performance is not indicative of future results. No client or advisory relationship is formed by reading this newsletter. Readers are solely responsible for their own decisions and should conduct independent research and consult a licensed professional before acting on any information. The author and publisher disclaim any liability for losses incurred based on this content. Full terms: https://globalsignalhq.substack.com/tos · © Global Signal™