


This was a rough week for anyone holding metal, and I’m not going to soften that. Gold broke below $4,000 an ounce on Wednesday for the first time since November, the end of a four-day slide that took it to roughly $3,977. Silver was hit far harder, dropping to around $56.50, its lowest in seven months, and now sitting about 47% below its January peak. A chunk of that silver damage — nearly 12% — happened in just two days. If you’ve been watching your statement, this week stung.
Then something happened on Thursday that’s worth understanding, because it tells you more about where gold really stands than the whole painful slide before it. The government released its key inflation gauge, and it came in hot — 4.1% over the past year, the highest in three years. Normally, hot inflation that keeps the Fed aggressive is bad for gold. And yet gold didn’t fall on the news. It rose, climbing back above $4,000. On a day when the inflation number gave the Fed every reason to stay tough, gold went up anyway.
That reaction is the story this week. When an asset has been beaten down for days and then refuses to fall on news that should hurt it, the market is telling you the selling has largely run its course and the buyers are stepping back in. Let me walk you through why gold dropped, why silver dropped so much more, and why Thursday’s quiet rebound matters more than the headlines about the break below $4,000.
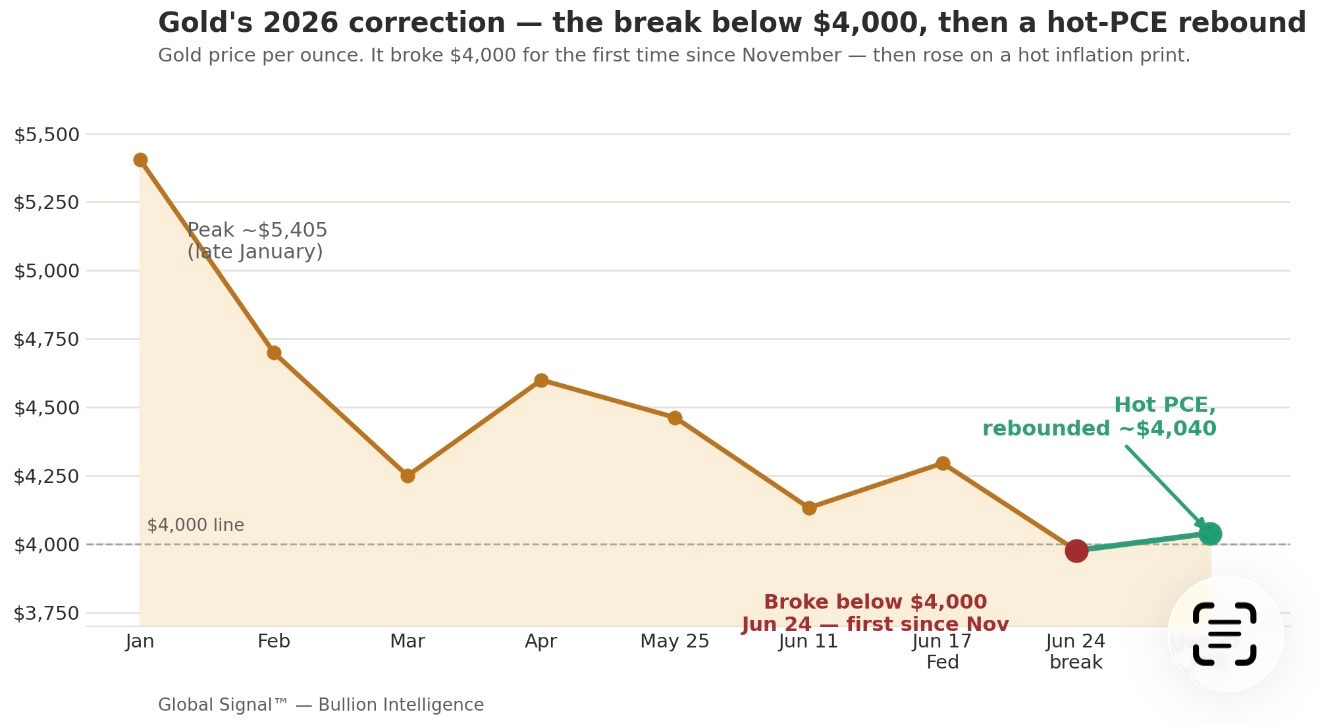
The Picture in One Chart
The chart above lays out gold’s whole 2026 journey, and this week’s move sits at the very end. Gold peaked near $5,405 in January, ground lower through the spring as the Iran war drove up oil and the Fed turned hawkish, and this week finally cracked the $4,000 line — that red dot — for the first time since November. The green dot is Thursday: gold rising back above $4,000 on a hot inflation print. That little bounce off the low, on bad news, is the part worth paying attention to.
Opening Signal
Here’s the heart of what happened: gold’s drop this week wasn’t about gold losing its value. It was about two outside forces, and both of them have a shelf life.
The first force was the Federal Reserve. Two weeks ago, new Fed chairman Kevin Warsh ran his first meeting and came in tougher on inflation than anyone expected, with nine of eighteen Fed officials now projecting at least one rate increase this year. That sent the US dollar to its highest level in more than a year. A strong dollar and the threat of higher rates are both headwinds for gold, because gold pays no interest, and when you can earn more in a savings account or a Treasury, the cost of holding metal goes up. That’s been grinding on gold all week.
The second force was simpler and more temporary: forced selling. When tech stocks dropped and crypto kept bleeding this week, some investors had to sell whatever they could to raise cash and cover losses elsewhere. Gold and especially silver got caught in that scramble — not because anyone decided metal was worthless, but because it’s liquid and easy to sell when you need cash fast. That kind of selling is mechanical, and it burns out quickly.
Neither of those forces changes a single thing about why gold matters over the long run. And Thursday, when gold rose on hot inflation, you got the first sign that both forces are starting to exhaust themselves.
Executive Signal
The rebound on hot inflation is the signal, not the break below $4,000. Gold dropping under $4,000 grabbed the headlines, but the more important event was what happened next: a 4.1% inflation print, a three-year high, and gold rose anyway. The reason is a concept traders call “priced in” — the market had already adjusted for a hawkish Fed two weeks ago, so when the hot number arrived, there was nothing left to sell on. A beaten-down market that rises on bad news is usually a market that has found its footing.
The drop had two temporary causes, and the rebound suggests both are fading. The hawkish-Fed dollar surge and the forced selling from stock and crypto losses drove the decline. Both are mechanical and short-lived rather than structural. Importantly, the same inflation report showed the monthly pace came in slightly softer than feared, which let Treasury yields ease and the dollar soften — exactly the relief gold needed to bounce. And oil has now fallen back to pre-war levels as the Iran conflict de-escalates, which should cool inflation in the months ahead and eventually loosen the Fed’s grip.
Silver fell far more than gold, and that’s both the pain and the opportunity. Silver dropped to a seven-month low near $56.50, down 47% from its January high, with the gold-to-silver ratio jumping to about 68 from 50 in January. The reason is that silver is half industrial metal, so it gets hit by both the monetary headwinds and the growth fears, and it moves two to three times as much as gold in either direction. But here’s the striking part: silver is in its sixth straight year of supply deficit, the shortage is the biggest in modern history, and yet the price is acting as if no one wants it. That gap between a record physical shortage and a crashing paper price is the kind of dislocation that tends to resolve in the patient holder’s favor.
The structural floor under gold hasn’t moved, even at these lows. Central banks bought 244 tonnes in the first quarter, a record 45% of them plan to add more gold over the next year, and every major bank’s year-end target — Goldman at $4,900, JPMorgan at $6,000, Wells Fargo above $6,000 — sits far above today’s price. Q1 saw the highest first-quarter gold demand on record. The paper price fell this week; the foundation didn’t budge.
For the patient holder, this is a deeper discount inside an intact long-term bull market. The forces that pushed gold down are temporary, the rebound on hot inflation suggests they’re fading, silver offers the deeper bargain, and the central banks keep buying. Nothing about the long-term case changed this week — only the price did.
Key Signals at a Glance
Gold broke below $4,000 Wednesday for the first time since November, bottoming near $3,977 after a four-session slide — then rebounded above $4,000 Thursday on the inflation print.
May PCE inflation came in at 4.1% year-over-year, a three-year high, but slightly soft month-over-month. Gold rose anyway — the hawkish Fed was already “priced in” two weeks ago.
Silver was hit far harder, falling to ~$56.50 (a seven-month low), down 47% from its January peak, with ~12% of that loss in just two days. The gold-to-silver ratio jumped to ~68 from 50 in January.
The drop had two temporary causes: the post-Warsh hawkish Fed driving the dollar to a one-year high, and forced selling as investors raised cash to cover stock and crypto losses. Neither is structural.
The floor held: central banks bought 244 tonnes in Q1 (record first-quarter demand), a record 45% plan to add more, and bank targets (Goldman $4,900, JPMorgan $6,000) sit far above spot.
Oil has fallen back to pre-war levels as the Iran conflict de-escalates, which should cool inflation in the months ahead and eventually ease the Fed pressure that’s weighing on gold.
The real positioning map starts below →
Conviction map, named vehicles for each thesis, forward scenarios with confidence tiers, the Cycle & Cosmos read, and the Watch Triggers for the weeks ahead — in the Premium Subscription. Premium subscribers see this on publish day. Free subscribers receive it 7 days later.
Market Breakdown — Premium
This Week’s Pulse
Gold sits near $4,040 after a wild week that saw it break below $4,000 to $3,977 on Wednesday — its lowest since November — before rebounding on Thursday’s inflation data. The 10-year Treasury yield has eased back toward 4.4% and the two-year toward 4.12%, both relaxing slightly after the PCE print, which relieved one of the pressures on gold. The dollar remains near a one-year high around 101, still a headwind but off its peak. Silver is the more dramatic story at roughly $56-58, a seven-month low, with the gold-to-silver ratio stretched to about 68. Oil has retreated to pre-war levels as the Iran de-escalation continues, though a fresh report of an attack on a vessel near Hormuz on Thursday added a note of caution. The defining feature of the week is the divergence: gold held up relatively well and rebounded, while silver took a much harder beating — a gap that tells you exactly what’s driving the market right now.
Why Gold Dropped, in Plain Terms
Gold didn’t fall because anyone lost faith in it. It fell because of two specific, temporary forces. First, the Fed: Warsh’s hawkish first meeting two weeks ago sent the dollar to a one-year high and raised the odds of rate hikes, and a strong dollar plus higher rates makes non-yielding gold less attractive to traders in the short term. Second, forced selling: when tech stocks dropped and crypto continued its long bleed this week, investors who needed cash sold what they could, and liquid assets like gold and silver got caught in the scramble. Neither of these is about gold’s actual worth. The dollar will eventually come off its highs as the inflation picture improves with lower oil, and forced selling exhausts itself once the cash is raised. That’s why the rebound came so quickly.
Why Silver Got Crushed Worse
Silver’s deeper drop confuses a lot of people, so it’s worth explaining. Silver wears two hats: it’s a precious metal like gold, but it’s also an industrial metal used in solar panels, electronics, and electric vehicles. That means it gets hit twice in a week like this — once by the monetary headwinds (the strong dollar, the rate fears) and once by growth worries (if the economy slows, factories use less silver). On top of that, silver is a smaller, thinner market than gold, so it swings two to three times as hard in both directions. When gold fell, silver fell much more. But that same double-edged nature is why silver tends to outrun gold when the recovery comes — and with silver in its biggest supply shortage in modern history, the setup underneath the ugly price is genuinely compelling.
Macro Undercurrents — Premium
Four forces are working under the surface this week.
The “priced in” rebound is the most important tell, and it deserves real weight. Markets don’t move on news; they move on news versus what was already expected. The hawkish Fed shock happened two weeks ago, and gold already fell for it then. So when this week’s hot inflation print arrived, there was nothing new to sell on — the bad news was already in the price. That’s why gold rose on a 4.1% number that, in a vacuum, should have hurt it. For a holder, understanding this mechanic is the difference between panic-selling into a bottom and recognizing that the selling pressure has largely spent itself. The rebound on bad news is the market quietly signaling exhaustion.
The forced-selling dynamic explains the violence and the speed, and it’s self-limiting. When investors face losses in stocks and crypto and need to raise cash, they sell their liquid winners and anything that can be sold quickly, regardless of its fundamentals. That’s why silver, even in a record shortage, can drop 12% in two days — it’s not a referendum on silver, it’s a scramble for liquidity. The crucial point is that this kind of selling has a natural end: once the cash is raised and the margin calls are met, the forced sellers are done, and the price is free to reflect fundamentals again. Thursday’s bounce suggests that point may be near.
The silver shortage versus crashing price is the dislocation to understand. This is genuinely unusual: silver is in its sixth consecutive year of supply deficit, with the 2026 shortfall at 46.3 million ounces, and since 2021 the world has drawn down over 760 million ounces from above-ground stockpiles — nearly nine months of total global mine output. Supply barely responds to price, because roughly 70% of silver comes out of the ground as a byproduct of mining other metals. So you have a metal in a deepening physical shortage trading as if it’s unwanted. That can persist in the short term when investors are the marginal buyers and they’re scrambling for cash — but it’s not a stable equilibrium, and it tends to resolve sharply when sentiment turns.
The structural floor is being confirmed even as the price falls, which is the pattern of the whole correction. Central banks bought a record 244 tonnes in Q1, a record 45% of them plan to add more over the next year, and physical coin and bar demand is set to rise again in 2026, with US retail buying projected to jump sharply. Meanwhile every major bank’s year-end target sits 20-50% above today’s price. The paper market and the physical market are telling completely different stories: the paper market is panicking, and the physical market is accumulating. Over time, the physical market is the one that sets the floor.
Smart Money — Premium
Three institutional patterns define the week.
The central banks never stopped buying, and they’re the anchor under the price. Through this entire correction, the world’s central banks kept accumulating gold, and the World Gold Council’s latest survey showed a record share planning to buy more. These are the most patient, most informed buyers in the market, and they don’t sell into a hawkish-Fed week or a forced-selling scramble. They’re executing a multi-year strategy of diversifying away from the dollar, and a few months of price weakness doesn’t touch it. When you feel anxious about the price, remember that the biggest buyers in the world are using this exact weakness to keep accumulating.
The bank analysts are holding their high targets through the drop, which signals how they read it. Goldman at $4,900, JPMorgan at $6,000, Wells Fargo above $6,000 — these targets have survived the entire 2026 correction, including this week’s break below $4,000. When the analysts who set price forecasts watch gold fall this far and keep their numbers, they’re telling you they see the decline as a temporary, sentiment-driven move rather than a structural change. They may be wrong, but their conviction at these levels is itself information worth weighing against the week’s gloomy headlines.
Physical buyers are treating the dip as a discount, exactly as they have all year. Physical coin and bar demand rose in 2025 and is projected to climb again in 2026, with US retail demand set to jump sharply, even as the paper price falls. This is the behavior of people who understand that a correction in an intact bull market is an opportunity to accumulate cheaper, not a reason to flee. Thursday’s quick rebound off the lows had the same fingerprints — buyers waiting below $4,000, ready to step in when the forced sellers handed them metal cheap.
Conviction Map — Premium
Overweight — physical gold and silver in allocated form, silver-weighted exposure given how much harder it fell and the record shortage underneath it, gold and silver royalty and streaming names, and quality producers. The deeper drop created a better entry; the rebound on hot inflation suggests the selling is exhausting.
Tactical — this is a deeper accumulation zone than last week, and the forces that caused it are temporary. Accumulate in tranches — gold is defending the $4,000 area, and silver near $56-57 sits at a historically stretched discount. A further dip on renewed dollar strength would be an opportunity, not a warning. Keep dry powder for it.
Underweight — leveraged paper positions that get force-sold at exactly the wrong moment (this week showed why), unallocated accounts where you don’t own real metal, and weak miners that can’t endure a prolonged soft patch.
Hedges — physical metal remains the core hedge against the fiscal and currency-debasement story that the record central bank buying keeps confirming. Hold the structural allocation through the noise, and treat the dollar’s spike as the temporary move it is.
Portfolio Playbook — Premium
The cleanest expressions of the thesis, grouped by role. The emphasis this week leans toward silver and physical given the depth of the discount.
Physical and core exposure:
IAU (iShares Gold Trust) — low-fee core gold exposure, simple to hold in any brokerage account
SIVR (abrdn Physical Silver Shares) — physically-backed silver at a competitive fee, clean exposure to the deeper discount
PSLV (Sprott Physical Silver Trust) — fully allocated, redeemable physical silver for those who want delivery optionality
Royalty and streaming — the lower-risk way to own miners:
FNV (Franco-Nevada) — the largest, most diversified gold royalty, built to weather soft-price stretches
WPM (Wheaton Precious Metals) — silver-weighted royalty leverage, the cleanest play on a silver recovery and the record shortage
RGLD (Royal Gold) — a focused, financially disciplined royalty name
Producers and broad exposure:
AEM (Agnico Eagle) — a premier, low-cost gold producer with a strong balance sheet
PAAS (Pan American Silver) — a quality silver producer with real leverage to a silver repricing
GDX (VanEck Gold Miners ETF) — a diversified basket of major miners for one-ticket exposure
How to use the week: the break below $4,000 and silver’s plunge created a deeper discount than we’ve seen this cycle, driven by temporary forces that Thursday’s rebound suggests are fading. Accumulate in tranches rather than all at once, lean silver-heavy given the record shortage and the stretched ratio, and use the royalty names for resilience if the soft patch lingers. The central banks bought this weakness; patient holders can too.
Cycle & Cosmos — Premium
A Common-Sense Guide for Investors
Here’s something that happened this week that’s worth sitting with, because it’s one of those moments where the market quietly shows you its true character. For four days, gold got pushed down, down, down — finally cracking below $4,000 for the first time since last November. Everyone watching felt the fear. And then the government announced that inflation is running at its hottest in three years, which on paper is one more reason to sell gold. Instead, gold turned around and went up. It rose on the bad news. That’s not random. That’s a tell.
Watch how something reacts to bad news — that’s where the truth is. Anyone can look strong when the news is good. The real character of a thing shows up when it gets hit and refuses to fall. This week gold got hit with everything — a tough Fed, a soaring dollar, forced selling, and then a hot inflation number — and at the end of it, it was buying back above $4,000. When a market absorbs that much bad news and still turns up, it’s telling you the sellers have mostly finished and the patient buyers are taking over. That’s worth more than any forecast.
Two metals, two speeds — and the slower one is the tell. Notice that gold held up while silver got crushed. That’s not a flaw in silver; it’s the nature of the two metals. Gold is the calm, steady one — the monetary anchor that central banks hoard. Silver is the wild younger sibling, swinging two and three times as hard because it’s half industrial. When the storm hits, silver falls harder, which feels terrible — but it’s also why silver runs harder when the storm passes. The patient holder doesn’t panic at silver’s wildness; they understand it’s the price of admission for the bigger move later. And right now silver is the cheapest it’s been relative to gold all year, in the middle of its worst shortage in modern history. Remember that mismatch.
The forced sellers and the patient buyers are two different crowds. Here’s the deep pattern under this week. The people who sold gold and silver weren’t gold-and-silver people — they were stock and crypto people who needed cash and grabbed whatever they could sell. The people buying are the central banks and the long-term holders who think in decades. So what looked like “everyone’s dumping gold” was really one nervous crowd raising cash while a patient crowd quietly took the other side. When you understand who’s selling and who’s buying, the fear drains out of the chart. The weak hands are leaving; the strong hands are accumulating.
Where the long cycle still points. We remain in that 2025-2027 window where the old debt-based system gets tested and real, tangible assets matter. A week where the dollar spikes and gold dips doesn’t change that — if anything, a Fed forced to stay tough against inflation while government debt climbs past $37 trillion is exactly the stress in that window playing out. The price zigzagged down this week. The direction the deep cycle points hasn’t changed at all.
The takeaway. Don’t let a scary week at the bottom of a correction shake you out of a sound long-term position. This week gold proved its character — it took every punch and still rose on the worst news. The forces that pushed it down are temporary and already fading, silver is on deep discount in the middle of a real shortage, and the central banks are buying the whole way down. If metal is your anchor through the turbulence ahead, weeks like this are when you quietly add to the anchor, not when you cut it loose. Watch how things behave under pressure — gold just showed you.
What to watch right now:
Whether gold holds the $4,000 line on any pullback — it just defended it once; defending it again confirms the floor.
Whether silver leads the bounce back — when the wild younger sibling outruns gold, the recovery is usually real.
Oil and the Iran situation — oil back at pre-war levels should cool inflation and eventually ease the Fed pressure that’s weighing on metal.
Forward Scenarios — Premium
Reset-and-recover case — High confidence — The break below $4,000 and silver’s plunge mark the exhaustion low or close to it. Gold bases around $4,000 and recovers as the dollar comes off its highs and lower oil cools inflation into the second half. Silver leads the bounce on its record shortage and the stretched ratio, and the central bank floor holds throughout. Confirms if: gold holds the $4,000 area on any retest, silver holds the mid-$50s, and the dollar rolls over as inflation cools.
Deeper-dip case — Medium confidence — The dollar pushes higher on continued hawkish Fed expectations, gold tests toward $3,900 and silver toward the low $50s before the physical and central bank demand catches it. This would be the deepest discount of the cycle and the best entry, not a thesis break, because the structural drivers remain fully intact. Confirms if: the dollar breaks higher, gold loses $4,000 again on a fresh hawkish signal, but physical demand absorbs it.
Renewed-shock case — Speculative — The Iran de-escalation reverses (the Thursday vessel attack near Hormuz is a reminder it’s fragile), oil spikes back up, and the stagflation mix returns. Gold benefits from renewed safe-haven demand even against the rate headwind, and the recovery comes faster and sharper. Confirms if: the Hormuz situation re-escalates, oil breaks back above $90, and safe-haven demand returns.
Watch Triggers — Premium
Whether gold holds the $4,000 area. It broke below and recovered once; holding this zone on any retest confirms the exhaustion low. A decisive break toward $3,900 opens the deeper-dip scenario.
The US dollar index. At a one-year high near 101, it’s the immediate headwind. Watch whether it extends or rolls over — a softening dollar is the catalyst that would let gold’s structural bid reassert.
The gold-to-silver ratio, stretched near 68. Compression back down confirms silver is leading the recovery, historically the most powerful phase of a metals bull. Watch for silver to outperform gold on up days.
Oil and the Strait of Hormuz. Oil’s return to pre-war levels is cooling inflation, but Thursday’s reported vessel attack shows the de-escalation is fragile. Renewed conflict would spike oil and revive the safe-haven bid.
Fed signals into the September and December meetings. Markets price meaningful odds of a hike. Any softening in the hawkish tone, especially as lower oil cools inflation, would relieve the pressure that’s weighed on gold all month.
TL;DR — Premium
Gold broke below $4,000 Wednesday for the first time since November, bottoming near $3,977 after a four-session slide, and silver got hit far worse — down to ~$56.50, a seven-month low, off 47% from its January peak. Then May inflation came in at 4.1%, a three-year high, and gold rose anyway, back above $4,000. That rebound on bad news is the week’s real story: the hawkish Fed was already “priced in” two weeks ago, so the selling had largely exhausted itself.
The drop’s two causes — the post-Warsh dollar surge to a one-year high and forced selling from stock and crypto losses — are both temporary. Silver fell harder because it’s half industrial and far more volatile, but it’s in its sixth straight year of supply deficit, the biggest shortage in modern history, trading as if unwanted. Meanwhile the floor held: record Q1 central bank buying, a record 45% planning to add more, and bank targets (Goldman $4,900, JPMorgan $6,000) far above spot.
Positioning stays overweight physical and quality miners — royalty (FNV, WPM, RGLD), producers (AEM, PAAS, GDX), physical (IAU, SIVR, PSLV) — silver-weighted given the deeper discount. Accumulate in tranches, keep powder for a possible test of $3,900. The Cycle & Cosmos read: watch how something behaves under pressure — gold took every punch this week and still rose on the worst news. The weak hands are selling; the strong hands are buying.
Gold broke $4,000. Then it rose on hot inflation. That tells you who’s really in control underneath.
— Written by The Global Signal Team
Global Signal™ is published for informational and educational purposes only. Nothing in this newsletter constitutes financial, investment, legal, or tax advice, nor a recommendation to buy, sell, or hold any security, asset, or strategy. The Cycle & Cosmos section is offered as interpretive and educational commentary only and makes no claim of causative effect on markets. All opinions are those of the author at the time of publication and are subject to change without notice. Markets involve risk, including possible loss of principal. Past performance is not indicative of future results. No client or advisory relationship is formed by reading this newsletter. Readers are solely responsible for their own decisions and should conduct independent research and consult a licensed professional before acting on any information. The author and publisher disclaim any liability for losses incurred based on this content. Full terms: https://globalsignalhq.substack.com/tos · © Global Signal™