

Thursday was the kind of day that’s supposed to crush gold, and for a few hours it did exactly that.
Before lunch, every alarm in the building was going off at once. The government reported that wholesale inflation jumped 6.5% over the past year, the hottest reading since late 2022. The European Central Bank raised interest rates for the first time since 2023. And overnight, US and Iranian forces had struck each other for the second night running near the Strait of Hormuz. Higher inflation, tighter money, a widening war — that combination normally sends people running from gold toward the safety of cash and a strong dollar, because gold pays no interest and a higher-rate world makes that a costlier thing to hold.
So gold did what the textbook says. It fell to about $4,023 an ounce in the morning, its lowest level since last November. Silver dropped to $63.52, its weakest since December. If you were watching the screen at 10 a.m., you’d have felt sick.
Then something happened that’s worth paying close attention to. By the afternoon, both metals had turned around and closed higher. Gold clawed back to roughly $4,133. Silver finished up more than 3.5% on the day. On a day when every piece of news pointed down, the metal went up. After a long career watching markets, I can tell you that’s the kind of signal that matters more than any single price. When an asset refuses to fall on news that should bury it, the market is telling you something about who’s really in control underneath.
Let me walk you through what’s actually going on, why this correction has been so painful, and why I think the Thursday reversal is the more important story than the months of decline that came before it.
The Picture in One Chart
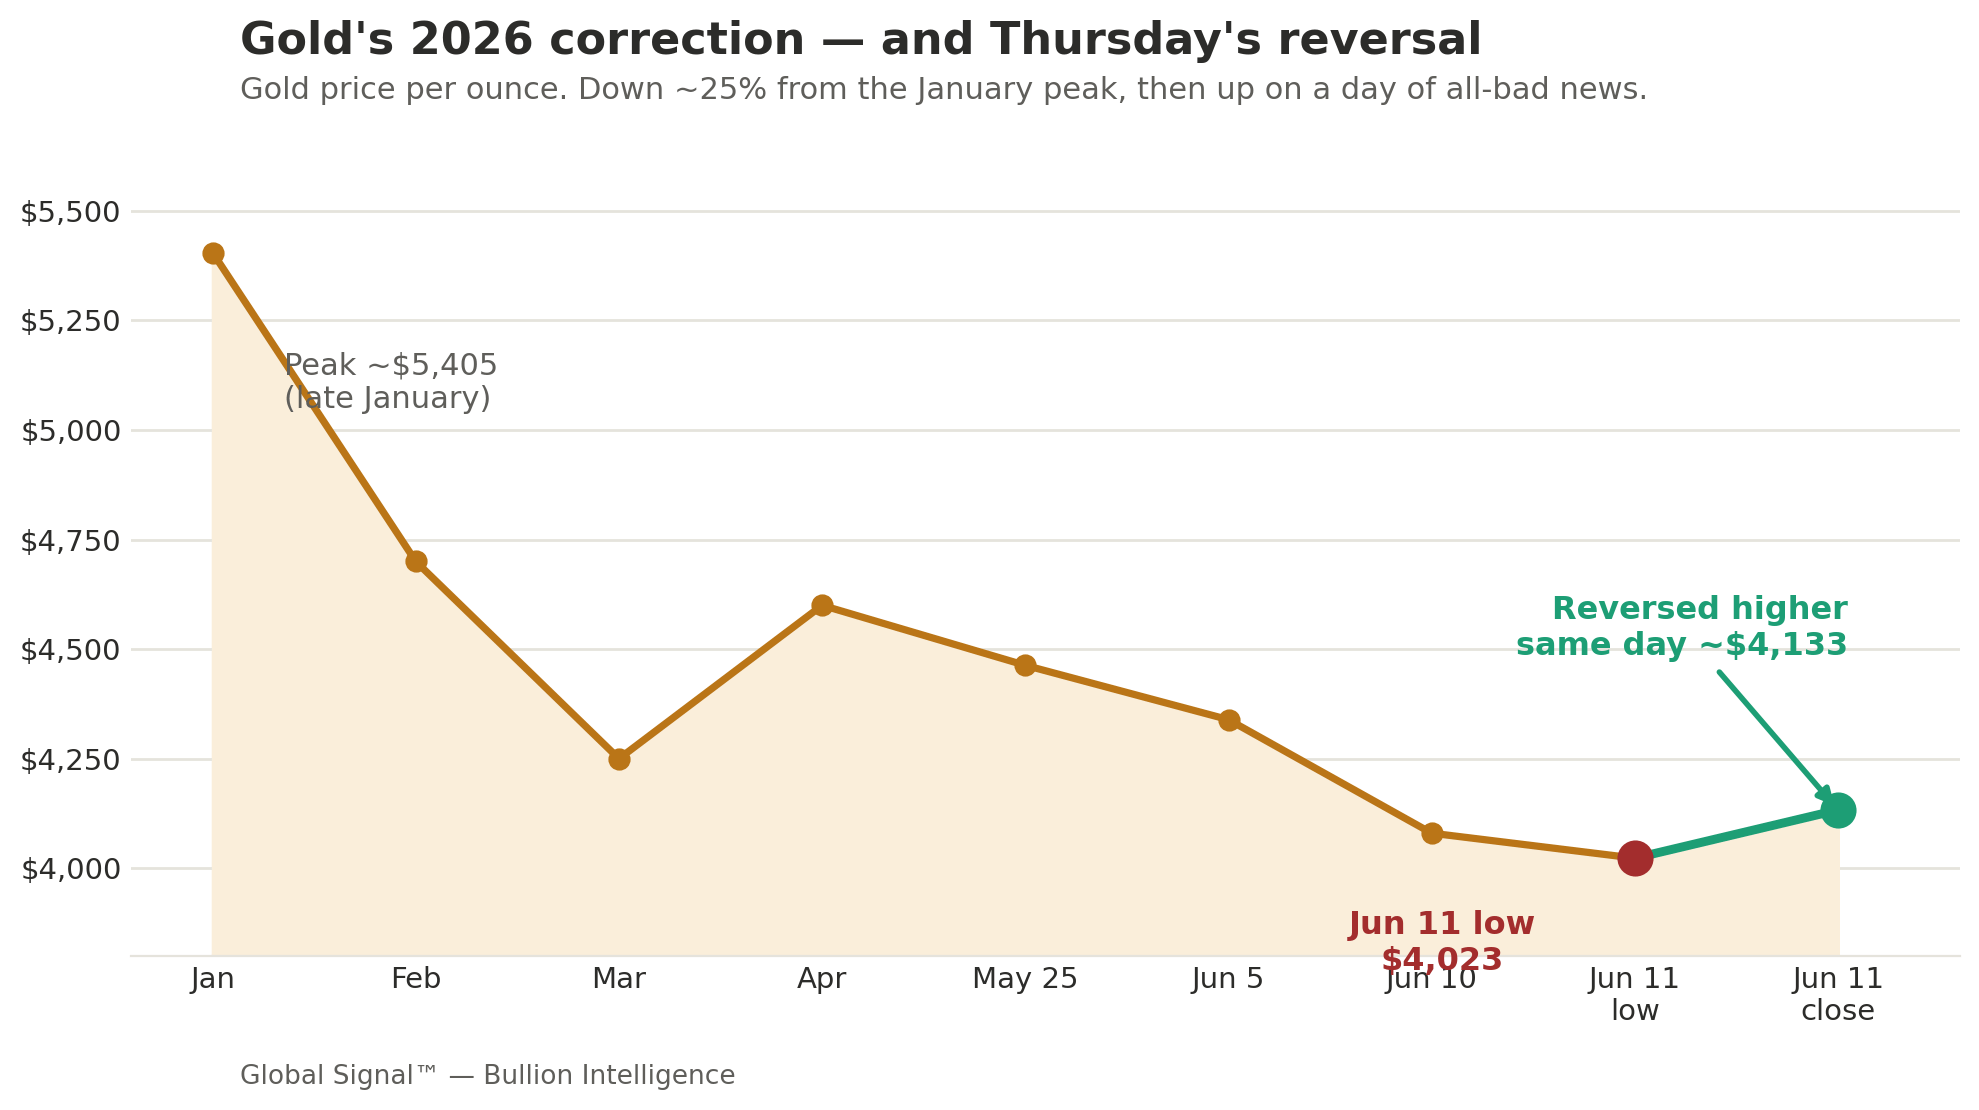
The chart above tells the whole 2026 story at a glance. Gold ran to a peak near $5,405 back in January, then spent the spring grinding lower as the Iran war drove up oil and inflation and the Fed slammed the door on rate cuts. That brought it down about 25% from the top — a genuinely painful correction, and there’s no point pretending otherwise. But look at the last two dots. The red one is Thursday morning’s low near $4,023. The green one is where it closed, higher, the same day. That little red-to-green flip is what this issue is about.
Opening Signal
Here’s the one thing to understand this week: the reason gold has fallen is also the reason it’s likely to recover, and Thursday showed the hinge.
Gold has been falling for months because the Iran war pushed up oil, oil pushed up inflation, and rising inflation killed any hope of the Federal Reserve cutting interest rates. Higher rates make gold, which pays you nothing to own it, less attractive next to a savings account or a Treasury bill. That’s the rate channel, and it’s been a headwind all spring. But that same war is also the thing that keeps a floor under gold, because a closed Strait of Hormuz and a widening Middle East conflict are exactly the kind of danger that sends serious money into hard assets. For months the rate headwind was winning. Thursday, with the worst possible news on the table, the floor held and the buyers stepped back in.
That’s the tell. When the news is all bad and the price still won’t break, the sellers have run out of ammunition and the patient buyers are quietly taking the other side.
Executive Signal
The reversal is the signal, not the decline. Gold and silver both hit multi-month lows Thursday morning on a genuinely brutal batch of news, then reversed and closed higher. A market that rallies on bad news is a market that has likely found its sellers’ exhaustion point. After a 25% correction, that kind of intraday turn on heavy bad news is the sort of thing that often shows up near the end of a decline rather than the middle of one.
The bad news itself is, oddly, good for gold over time. The hottest wholesale inflation since 2022, an ECB forced to hike into a slowing economy, and a war that won’t quit all point to the same conclusion: this is stagflation — rising prices alongside weakening growth — and it’s global, not just an American problem. When the European Central Bank raises rates on an energy shock it can’t fix, it’s admitting that no central bank can interest-rate its way out of a supply problem. Those are precisely the conditions gold was built for. And a hiking ECB supports the euro against the dollar, which over time pulls the dollar down and removes one of gold’s biggest headwinds.
The floor under gold is real, sized, and still buying. The thing that’s held this whole correction together is sovereign demand. Central banks bought 244 tonnes in the first quarter, resumed net buying in April after a brief wobble, and continue building reserves regardless of the day-to-day price, because they’re diversifying away from dollar assets on a multi-decade horizon that a few months of volatility doesn’t change. Poland is buying toward a 700-tonne target. China just logged its eighteenth straight month. This is the patient money, and it hasn’t flinched.
Silver is where the real opportunity may sit. Silver took the steeper beating in this correction, falling to $63.52 before Thursday’s bounce, and it’s now sitting more than 37% below its January high. But silver has something gold doesn’t: it’s an industrial metal as much as a monetary one, used in everything from solar panels to electronics, and it’s been in a supply deficit for years running. When the recovery comes, silver has historically run harder than gold. For the patient investor, the steeper the discount, the more interesting it gets.
The bottom line for anyone holding metal: this has been a painful but normal correction inside an intact long-term bull market, the fundamentals that drove gold to records haven’t changed, and Thursday was the kind of day that tends to mark turns rather than continuations.
Key Signals at a Glance
Gold fell to ~$4,023 Thursday (lowest since November) and silver to $63.52 (lowest since December) on a stack of bad news — then both reversed and closed higher, gold near $4,133, silver up 3.5%+.
May wholesale inflation (PPI) jumped 6.5% year-over-year, the hottest since November 2022, almost entirely from the Iran-driven energy shock.
The European Central Bank raised rates for the first time since 2023 and cut its growth forecast — openly blaming the energy shock. That’s stagflation, and it’s global.
Gold is down ~25% from its January peak near $5,405; silver down 37%+ from its high. A steep correction, but inside an intact long-term bull market.
Central banks remain the floor: 244 tonnes bought in Q1, net buying resumed in April, Poland and China still accumulating regardless of price.
US and Iranian forces struck each other for a second straight night near Hormuz; the strait’s status is disputed but the energy shock that’s driving inflation isn’t going away.
The real positioning map starts below →
Conviction map, named vehicles for each thesis, forward scenarios with confidence tiers, the Cycle & Cosmos read, and the Watch Triggers for the weeks ahead — in the Premium Subscription. Premium subscribers see this on publish day. Free subscribers receive it 7 days later.
Market Breakdown — Premium
This Week’s Pulse
Gold sits near $4,080 to $4,133 after a wild Thursday that saw it trade down to $4,023 before reversing higher. That’s its lowest zone since November 2025 and roughly 25% below the January peak. Silver is the more dramatic story, having dropped to $63.52 — its weakest since December — before bouncing more than 3.5% to finish the session green. The gold-to-silver ratio has pushed back up toward the mid-60s as silver fell harder during the selloff, which, for those who watch that ratio, is the kind of stretched reading that has historically preceded silver outperformance. The 10-year Treasury yield is elevated, the dollar is firm, and oil remains the engine of all of it, with Brent holding above $100 on the renewed strikes. The technical condition got washed out this week: gold’s RSI dropped to around 28, in oversold territory, which is the kind of reading that tends to accompany the tail end of a decline rather than the start of one.
Why the Selloff Happened
It’s worth being clear-eyed about what drove this correction, because understanding it is what tells you whether to worry. Gold didn’t fall because anyone lost faith in gold. It fell because of two specific, identifiable shocks landing at the same time. First, the Iran war shut down a chunk of the world’s oil flow through the Strait of Hormuz, which sent energy prices up more than 23% year-over-year and drove most of the inflation we’re now seeing. Higher inflation killed the rate cuts the market had been expecting, and without rate cuts, the cost of holding a non-yielding asset like gold stays high. Second, the strong May jobs report a week ago confirmed the economy was running hot enough that the Fed might actually have to raise rates, not lower them. Those two things — an oil shock and a hawkish Fed surprise — are temporary by nature. The war will resolve or the market will finish pricing it. Neither one changes the long-term reasons to own gold.
The Reversal in Detail
What made Thursday remarkable was the sheer pile-up of bearish news that gold managed to shrug off. The PPI came in hot. The ECB hiked. The war escalated overnight. Any one of those should have pushed gold lower, and all three together did — for about half a day. Then buyers stepped in at $4,023 and silver at $63.52, and by the close both were green. Silver had fallen for five straight sessions going into Thursday as traders positioned for bad data; when the bad data arrived and the metal turned up anyway, it had the feel of a market that had already priced the worst and run out of sellers. That’s the textbook definition of capitulation followed by reversal, and it’s the most constructive single-day action we’ve seen in this correction.
Macro Undercurrents — Premium
Four forces are working under the surface this week.
The reversal points to seller exhaustion after a long decline. Markets don’t bottom on good news; they bottom when the last seller has sold and there’s no one left to push the price down. Thursday had all the hallmarks: a multi-month low, an oversold technical reading, five straight down days in silver, a stack of bad news, and then a refusal to keep falling. None of this guarantees the bottom is in — these things are only ever clear in hindsight — but the behavior is far more consistent with the end of a decline than the middle of one. For anyone who’s been waiting for a sign that the worst of the pain is passing, this is the most encouraging tape in months.
Global stagflation is the backdrop, and it’s gold’s natural habitat. The ECB raising rates while cutting its growth forecast is the clearest signal yet that the developed world is sliding into stagflation — rising prices with stagnating growth. This matters enormously for gold because the 1970s, the last great stagflation, was one of the best periods for the metal in history. When inflation is high and growth is weak, stocks struggle, bonds struggle, cash loses purchasing power, and gold becomes one of the few places that holds value. Every major central bank now tightening into an inflation they didn’t create and can’t fix is, in effect, an advertisement for hard assets.
The dollar dynamic is quietly shifting in gold’s favor. Here’s a subtle point that most coverage misses: when the ECB raises rates, it strengthens the euro against the dollar, which over time pulls the dollar index down. A weaker dollar is a tailwind for gold, because gold is priced in dollars and becomes cheaper for the rest of the world to buy when the dollar softens. So the same wave of global tightening that looks bearish on the surface contains, underneath it, one of the mechanisms that could lift gold in the second half of the year.
The structural floor remains fully intact. None of the long-term drivers have changed. US government debt exceeds $37 trillion with annual interest now above $1 trillion, which is the fiscal backdrop that pushes sovereigns toward gold in the first place. Central banks have been net buyers for four straight years. Physical demand for bars and coins rose 50% year-over-year in the first quarter even as the price corrected, because real buyers treat lower prices as a discount, not a warning. The correction shook the price; it didn’t touch the foundation.
Smart Money — Premium
Three institutional patterns define the week.
The sovereign buyers never stopped, and that’s the anchor. Through this entire correction, central banks kept accumulating. Poland led the spring buying and is building toward a 700-tonne target, sitting at roughly 30% of its reserves in gold. China extended its streak to eighteen straight months. For perspective, the US and major European central banks hold 60 to 70% of their reserves in gold, while China sits at just 9% and is clearly working to close that gap. These are multi-decade strategies that a quarter of price volatility doesn’t dent. The patient money is the smart money here, and it’s been buying the whole way down.
Physical buyers stepped into the weakness, exactly as they should. The first quarter saw bar and coin demand jump 50% year-over-year even as the price fell, the behavior of people who understand that a correction in an intact bull market is an opportunity to accumulate. Thursday’s reversal off the lows had the same fingerprints — buyers waiting at $4,023 in gold and $63.52 in silver, ready to take metal off the market when the panic sellers handed it to them cheap.
The forecasters see the second half differently than the first. The institutional consensus is that this correction is a setup, not a top. Metals Focus expects gold to resume its bull run in the second half of the year. The major banks’ year-end targets, many set well above current prices, haven’t been abandoned — they’ve simply been deferred by the oil shock and the Fed surprise. With gold at $4,080 and silver near $65, both metals sit 25 to 44% below where most institutional analysts expect them to finish the year. That gap is either a collective error by every major desk, or it’s the opportunity.
Conviction Map — Premium
Overweight — physical gold and silver in allocated form, silver-weighted exposure given how much harder it fell, gold and silver royalty and streaming names, and quality producers. The reversal strengthens the case for adding; the correction created the discount.
Tactical — for those who’ve been waiting, this washed-out, oversold, post-reversal zone is a more attractive entry than chasing strength was at the highs. The $4,000 area in gold and the low $60s in silver are the levels buyers just defended. Accumulate in pieces rather than all at once, in case the bottom needs another test.
Underweight — leveraged paper positions that force you out at exactly the wrong moment, unallocated accounts where you don’t truly own the metal, and weak miners that can’t survive a prolonged soft patch.
Hedges — physical metal is itself the hedge against the stagflation and currency-debasement scenarios now clearly unfolding. Hold the structural allocation regardless of the weekly noise, and keep some cash ready for a possible retest of the lows.
Portfolio Playbook — Premium
The cleanest expressions of the thesis, grouped by role. The emphasis this week leans toward silver and physical given the depth of the discount.
Physical and core exposure:
IAU (iShares Gold Trust) — low-fee core gold exposure, simple to hold in any brokerage account
SIVR (abrdn Physical Silver Shares) — physically-backed silver at a competitive fee, clean exposure to the deeper discount
PSLV (Sprott Physical Silver Trust) — fully allocated, redeemable physical silver for those who want the option to take delivery
Royalty and streaming — the lower-risk way to own miners:
FNV (Franco-Nevada) — the largest, most diversified gold royalty, built to weather soft-price stretches without operational risk
WPM (Wheaton Precious Metals) — silver-weighted royalty leverage, the cleanest play if silver leads the recovery
RGLD (Royal Gold) — a focused, financially disciplined royalty name
Producers and broad exposure:
AEM (Agnico Eagle) — a premier, low-cost gold producer with a strong balance sheet
PAAS (Pan American Silver) — a quality silver producer with real leverage to a silver repricing
GDX (VanEck Gold Miners ETF) — a diversified basket of major miners for one-ticket exposure without single-company risk
How to use this week: the reversal suggests the discount is being recognized, but a retest of the lows is always possible, so accumulate in tranches rather than backing up the truck on one day. The royalty names give you resilience if the soft patch lingers; silver and the silver-weighted names give you the most upside if the recovery runs the way these recoveries usually do. Size it so a retest doesn’t shake you out.
Cycle & Cosmos — Premium
A Common-Sense Guide for Investors
Think of gold like the tide, and this week the tide went all the way out. The water pulled back so far that the metal touched levels we hadn’t seen since last fall, and a lot of people stood on the beach feeling like the ocean had abandoned them. But anyone who’s watched enough tides knows that the water pulling out this far is also exactly how it sets up to come rushing back. The trick is not to panic at low tide.
The tide went out, then started to turn. Thursday was the clearest example you’ll ever see of a market hitting bottom and refusing to go lower. Every bit of news that morning said “sell,” the price dropped to its lowest in months, and then it turned around and closed higher anyway. In tide terms, the water reached its lowest point and started flowing back in while everyone was still worried about the mud. That doesn’t mean the tide is fully back tomorrow, but it does mean we’re likely past the lowest point of this particular cycle.
The long cycle still favors the patient. We remain in that 2025 to 2027 window where the old debt-based financial order gets tested and tangible, hold-in-your-hand assets come back into favor. A painful correction inside that window isn’t a contradiction — it’s how these things always go. The speculative excess gets shaken out first, the weak hands sell, and the patient owners of real assets come through the other side. The central banks of the world buying gold hand over fist while the price falls is the single clearest sign of which way the deep current is flowing.
The cosmic lens, pointing the same way. The long-cycle and planetary-cycle readers keep circling this same stretch as a period when trust in paper money and paper promises gets tested, and tangible value reasserts itself. You don’t need to believe in any of it to notice that the data, the cycles, and the central banks are all telling the same story. Gold doesn’t need the stars to make its case this week — a market that rises on a day of all-bad news made the case on its own. But it’s worth noting when every map agrees on the destination.
The takeaway. Don’t be the person who sells at low tide because the beach looks empty. This has been a frightening correction, but the foundation underneath gold — the debt, the stagflation, the central bank buying, the war — is fully intact, and Thursday’s reversal is the kind of day that tends to mark turns. If gold is your anchor through the turbulence ahead, low tide is when you quietly add to the anchor, not when you throw it overboard. Accumulate with discipline, keep some powder dry for a possible retest, and let the noisy season pass.
What to watch right now:
The Fed meeting June 16-17 — the biggest near-term event, and Warsh’s first as chair.
Whether gold holds the $4,000 line on any pullback — the difference between a finished correction and one more dip.
Whether silver leads the way back up — when the smaller, scrappier metal outruns gold, the recovery is usually real.
Forward Scenarios — Premium
Recovery case — High confidence — Thursday marked the seller-exhaustion low or something close to it. Gold bases in the $4,000 to $4,200 zone and turns up into the second half as the dollar softens on ECB tightening and the market finishes pricing the oil shock. Silver leads, the gold-to-silver ratio compresses back down, and the institutional second-half bull call plays out. Central banks keep buying throughout. Confirms if: gold holds above $4,000 on any retest, silver holds the low $60s, and the dollar rolls over as the euro strengthens.
Retest case — Medium confidence — gold dips back to test the $4,000 area or slightly below before the recovery takes hold, shaking out the last weak hands. This would be a deeper and better accumulation opportunity, not a thesis break, because the central bank floor and the stagflation backdrop remain fully intact. Patient buyers who kept dry powder get rewarded. Confirms if: gold briefly breaks $4,000 on a fresh oil or Fed shock but physical demand and central bank buying absorb it quickly.
Extended-pressure case — Speculative — the Fed actually hikes at its June meeting, the dollar strengthens further, and gold grinds lower toward $3,800 before finding footing. Even here, the structural drivers don’t change — this would be the deepest discount of the cycle and the strongest long-term entry, not a reason to abandon metal. Confirms if: the Fed signals or delivers a hike, the dollar breaks to new highs, and gold loses $4,000 decisively.
Watch Triggers — Premium
The Federal Reserve meeting June 16-17, Warsh’s first as chair. A hold with steady language likely confirms the reversal; an actual hike or hawkish surprise risks a retest of the lows. This is the single biggest near-term event.
Whether gold holds the $4,000 area on any pullback. That’s the line that separates a completed correction from a deeper retest. Holding it confirms the floor; losing it points to the extended-pressure case.
The gold-to-silver ratio. Stretched in the mid-60s after silver’s harder fall. Compression back down confirms silver is leading the recovery, historically the most powerful phase of a metals bull.
The dollar index as the ECB hike works through. A softening dollar is the quiet tailwind that could power the second-half recovery. Watch the euro-dollar rate.
The Iran war and Hormuz status. Continued conflict keeps the energy-inflation pressure on, cutting both ways; a genuine de-escalation would lower oil and could, counterintuitively, help gold by reviving rate-cut hopes.
TL;DR — Premium
Thursday, every alarm went off at once — the hottest wholesale inflation since 2022, Europe’s first rate hike since 2023, a second night of US-Iran strikes — and gold fell to a multi-month low near $4,023 and silver to $63.52. Then both reversed and closed higher. A market that rallies on bad news is usually a market that’s run out of sellers, and after a 25% correction, that’s the most encouraging tape in months.
The decline was driven by two temporary shocks — the Iran oil disruption and a hawkish Fed surprise — not by anything that changed gold’s long-term case. Meanwhile the floor held: central banks bought 244 tonnes in Q1, resumed buying in April, and haven’t stopped. The stagflation now spreading globally is gold’s natural habitat, and a hiking ECB should soften the dollar in gold’s favor.
Positioning stays overweight physical and quality miners — royalty names (FNV, WPM, RGLD), producers (AEM, PAAS, GDX), and physical vehicles (IAU, SIVR, PSLV) — with silver favored given its deeper discount. Accumulate in tranches in case the lows get retested. The Cycle & Cosmos read says the tide is far out, which is historically where bottoms form.
Every alarm went off. Gold went up anyway. After a long career watching markets, that’s the kind of day I pay attention to.
— Written by The Global Signal Team
Global Signal™ is published for informational and educational purposes only. Nothing in this newsletter constitutes financial, investment, legal, or tax advice, nor a recommendation to buy, sell, or hold any security, asset, or strategy. The Cycle & Cosmos section is offered as interpretive and educational commentary only and makes no claim of causative effect on markets. All opinions are those of the author at the time of publication and are subject to change without notice. Markets involve risk, including possible loss of principal. Past performance is not indicative of future results. No client or advisory relationship is formed by reading this newsletter. Readers are solely responsible for their own decisions and should conduct independent research and consult a licensed professional before acting on any information. The author and publisher disclaim any liability for losses incurred based on this content. Full terms: https://globalsignalhq.substack.com/tos · © Global Signal™